Why is extreme rainfall important?
Impacts from extreme rainfall can occur in a variety of ways. Prolonged steady rainfall can build up accumulations which lead to saturated ground and flooding as large rivers progressively break their banks. Short, intense events, as measured by these indices, can lead to flash flooding, with large quantities of rain falling in a single day or over a few days.
Intense rainfall occurring over a short period of time (a few days) can have severe impacts on our environment, as streams and small rivers respond quickly to the downpours. In built-up areas, where water cannot drain away fast enough, flash flooding can occur, inundating buildings, affecting transport, and endangering lives.
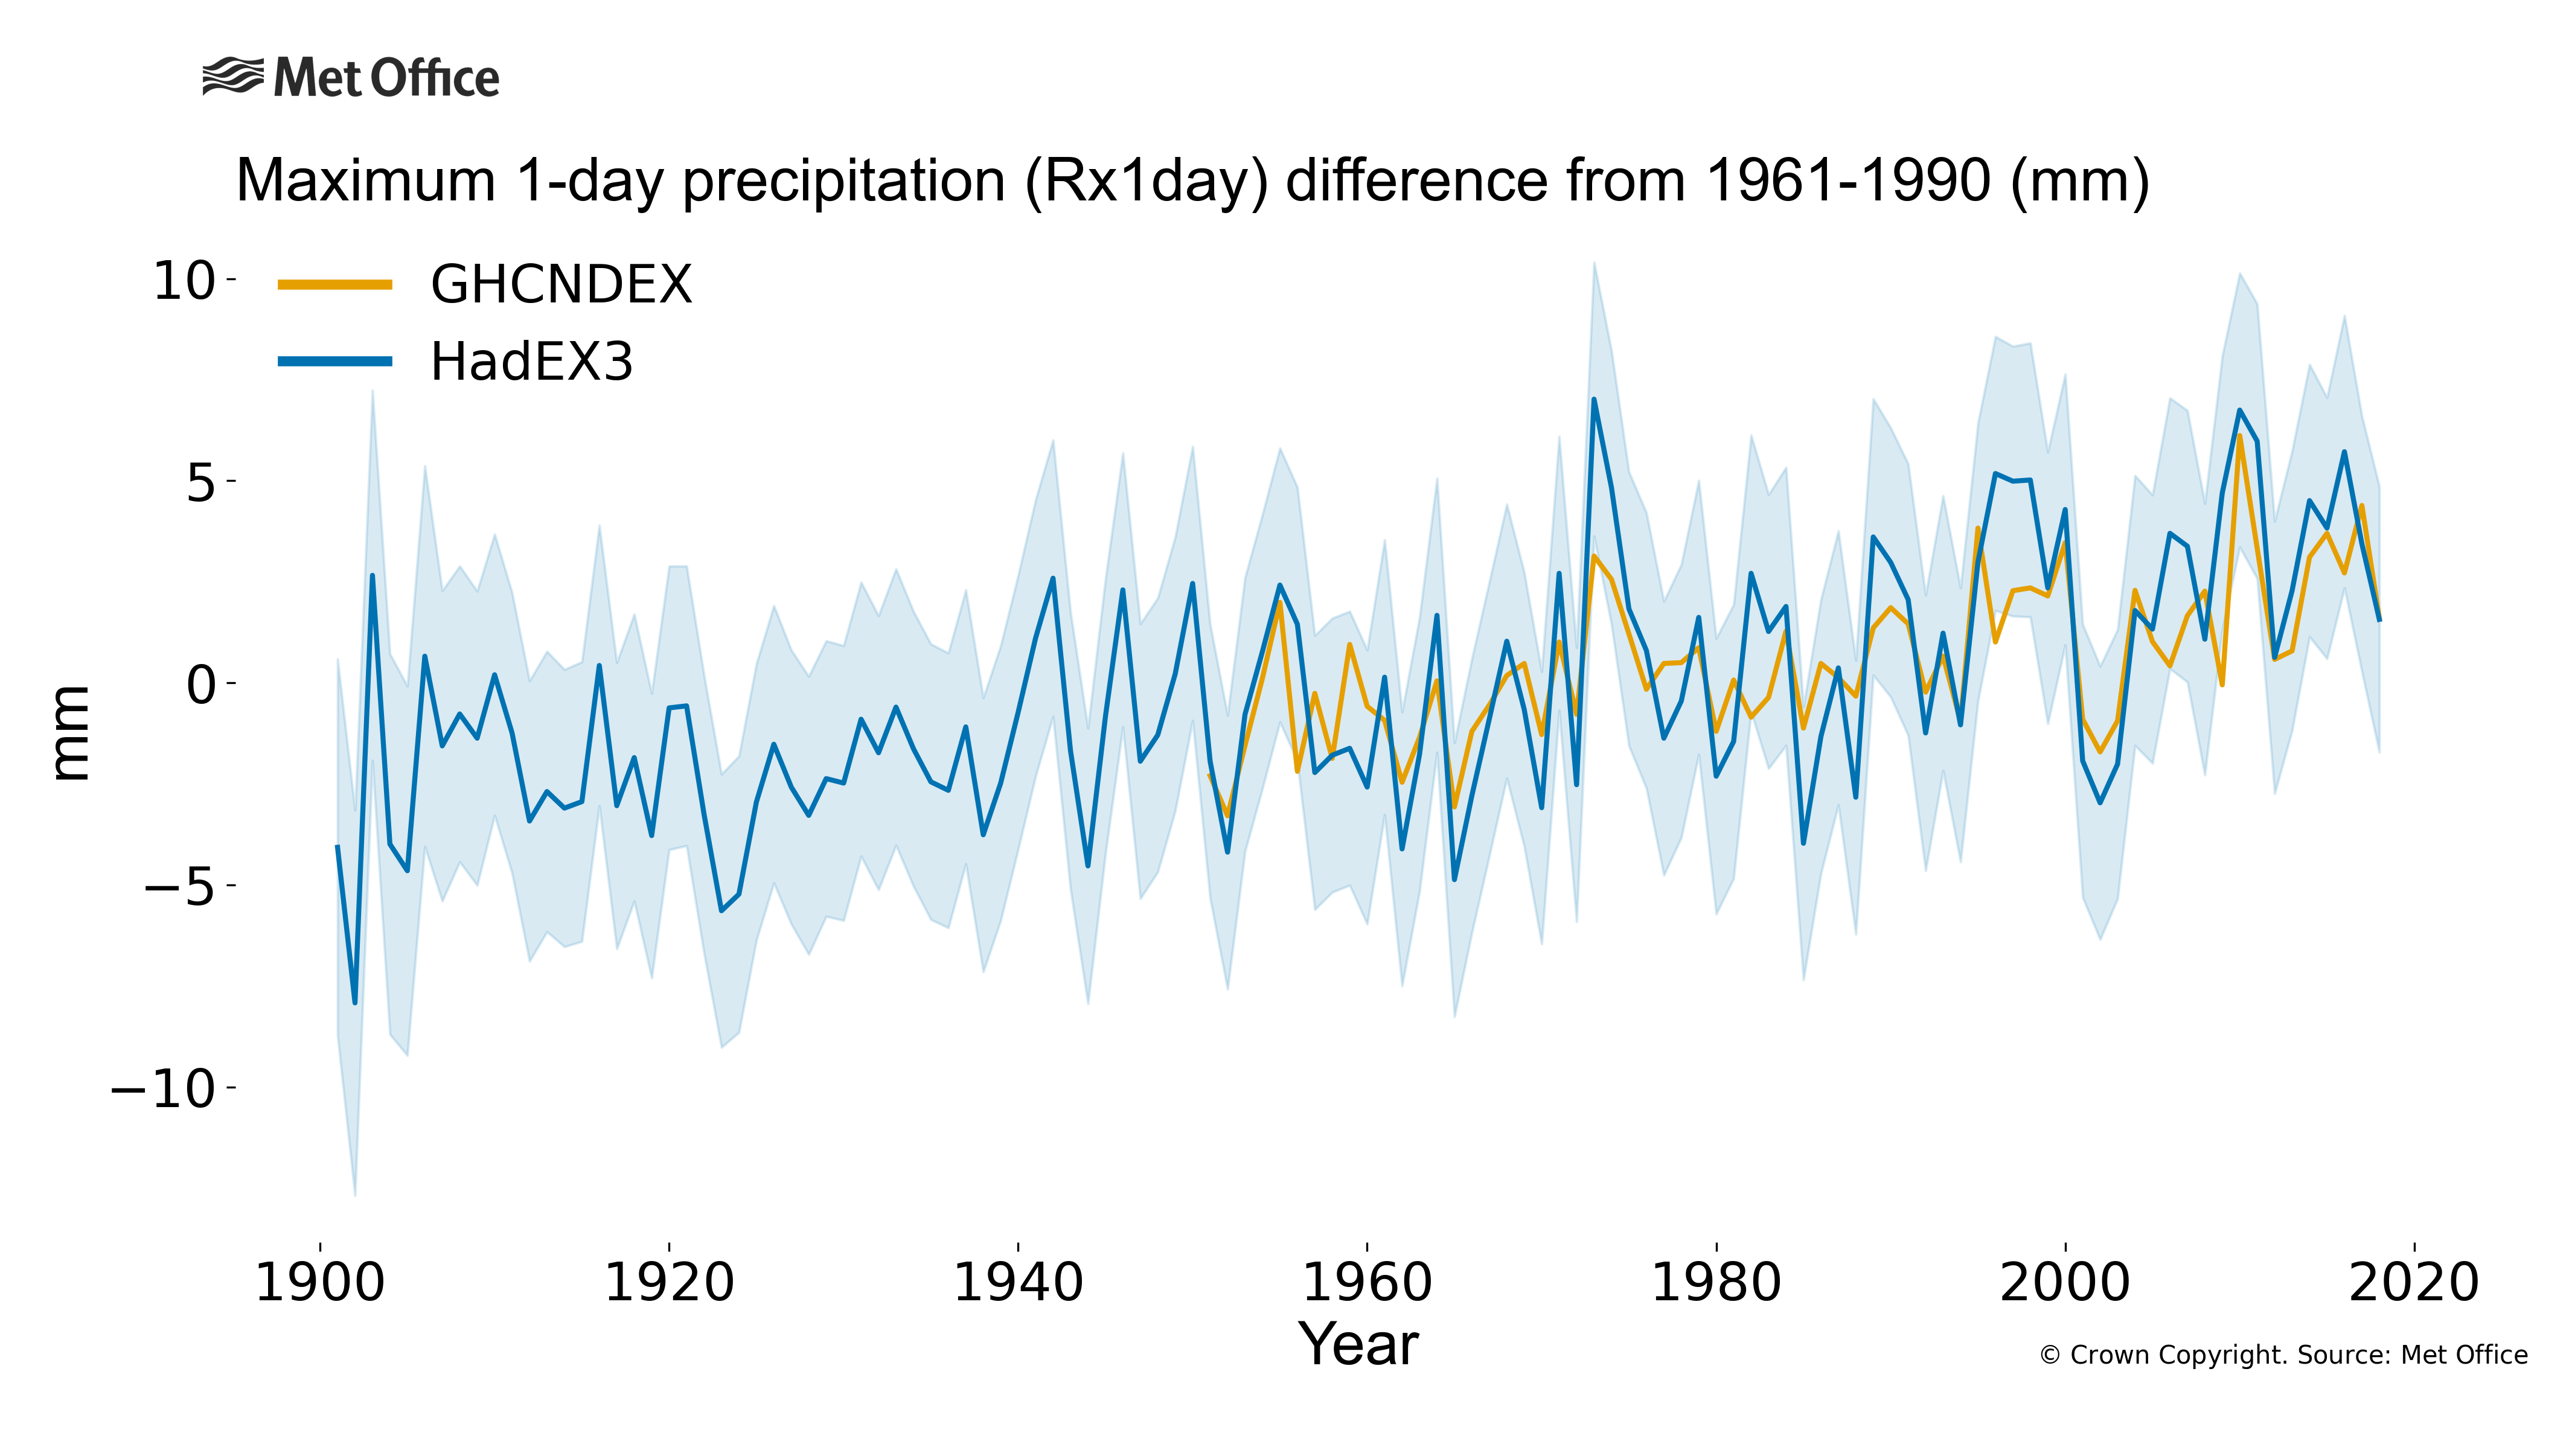
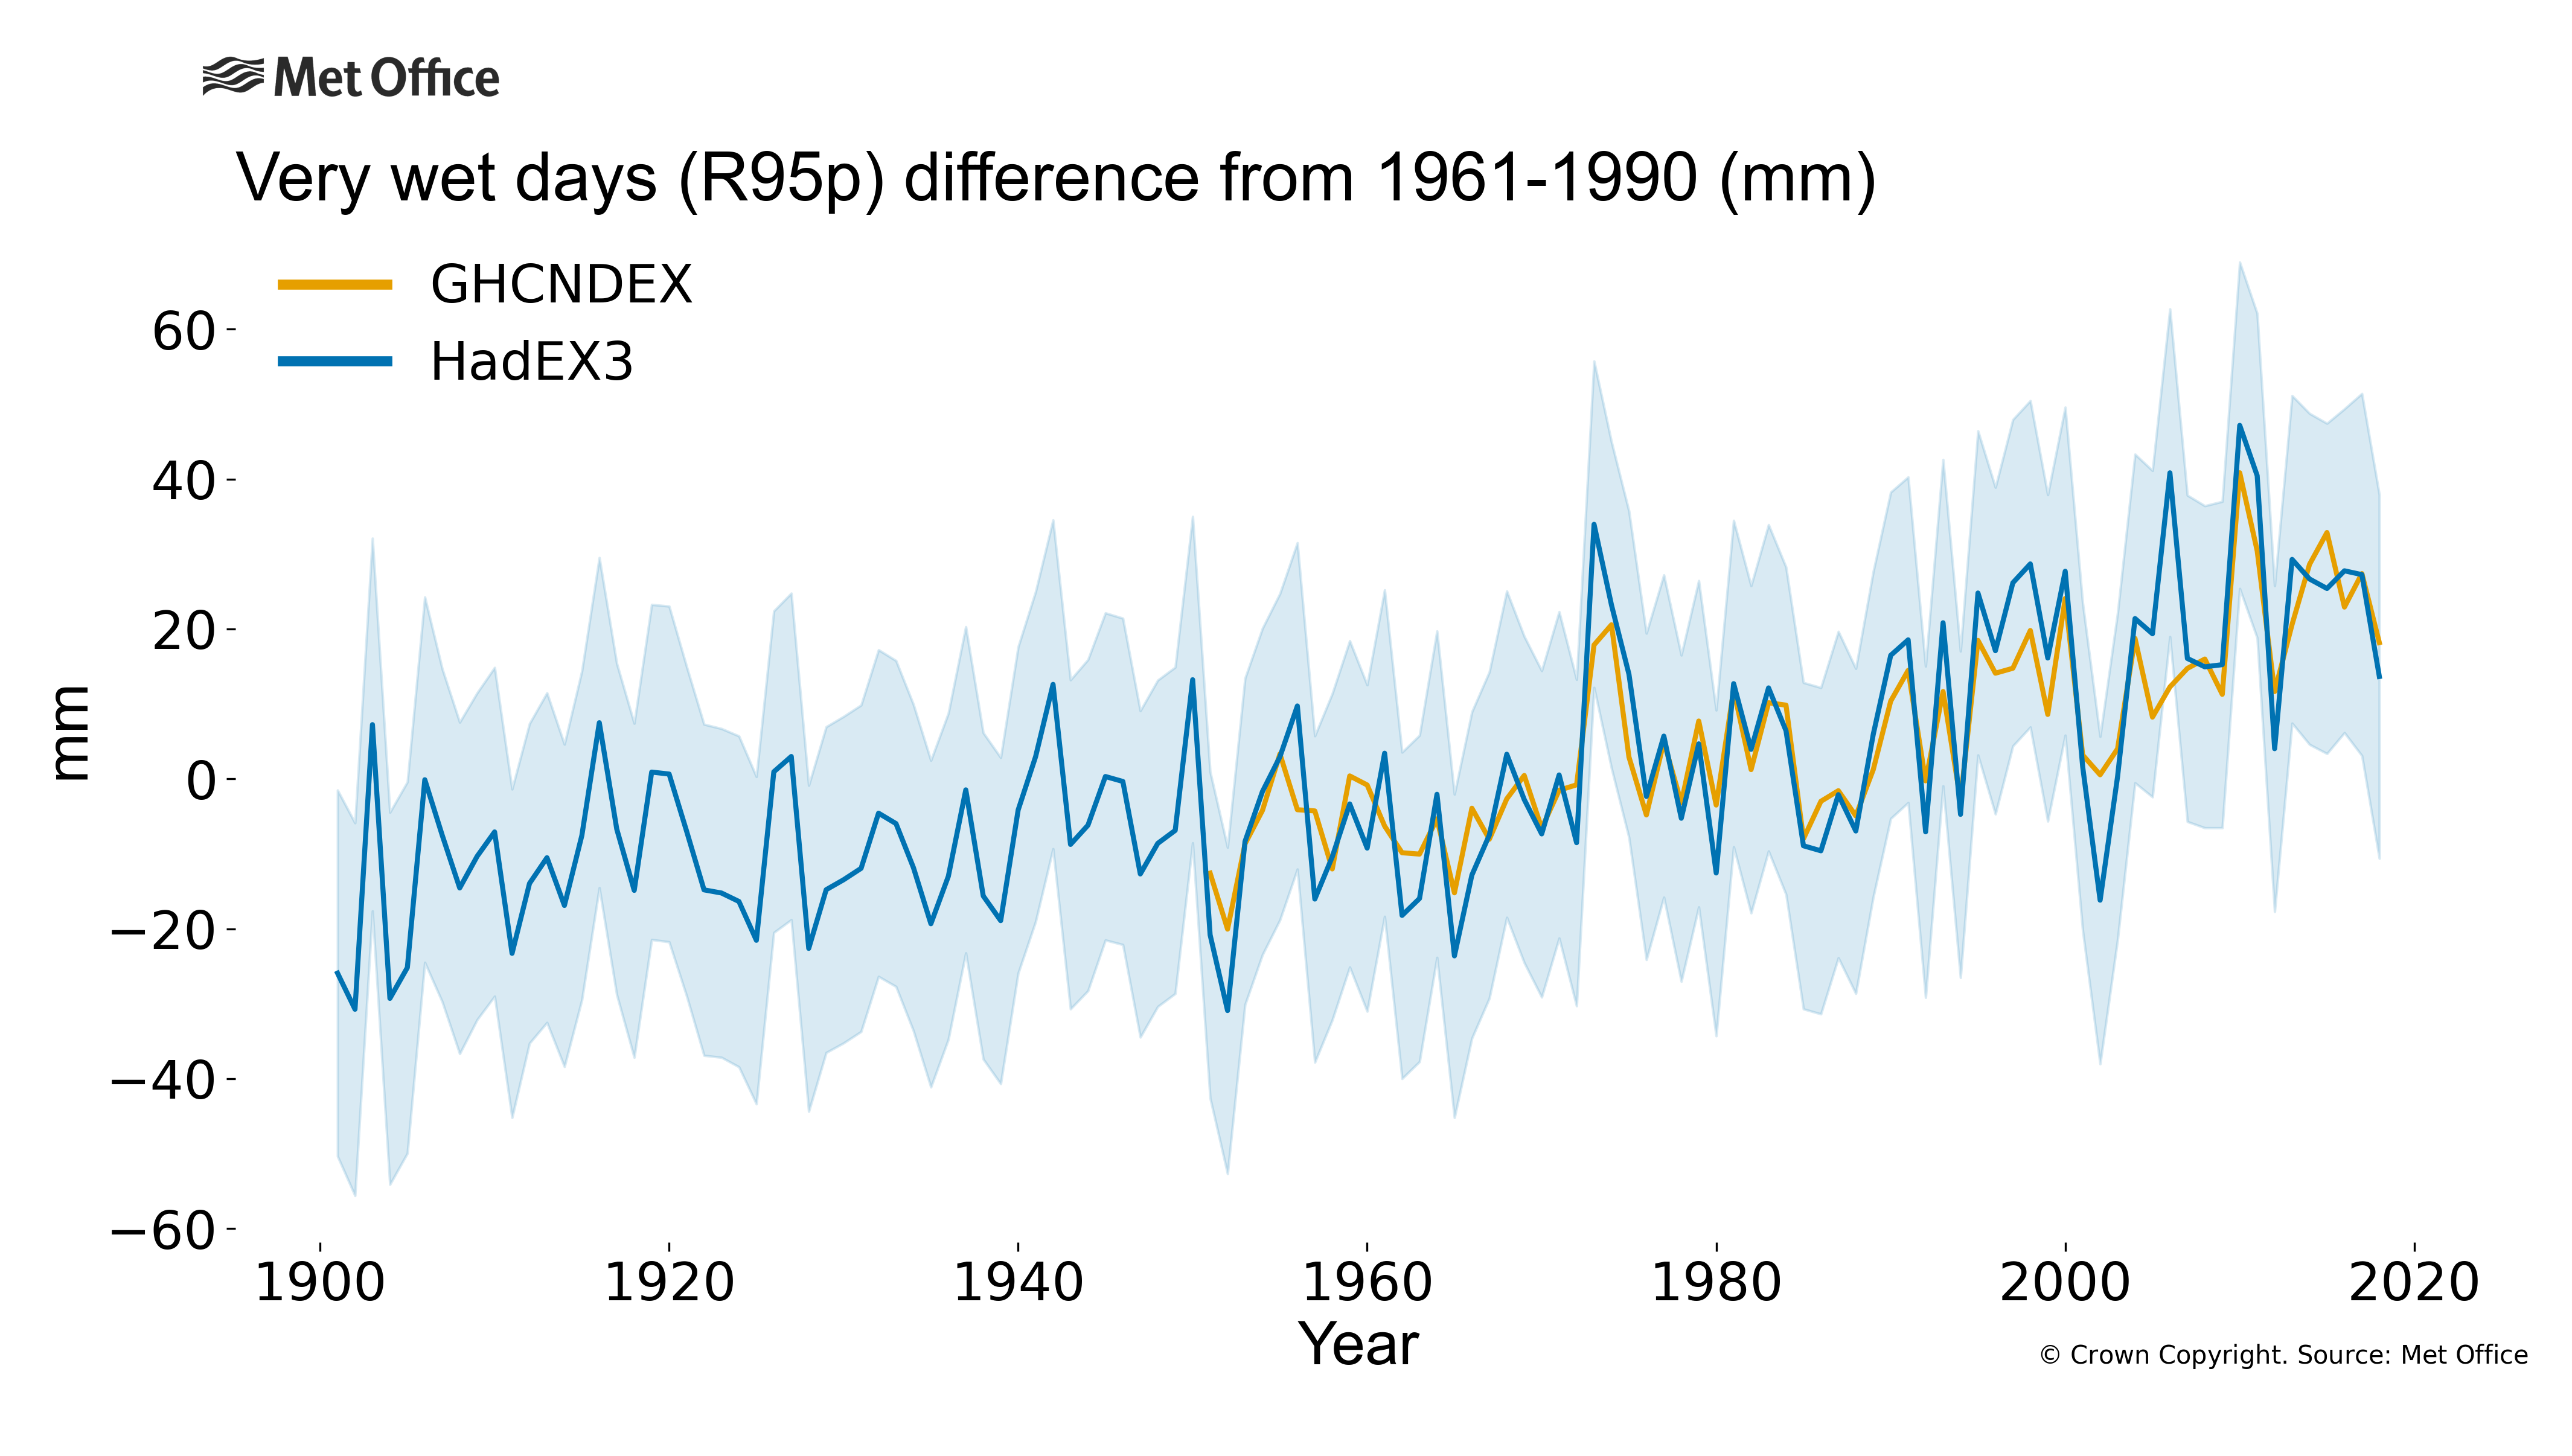
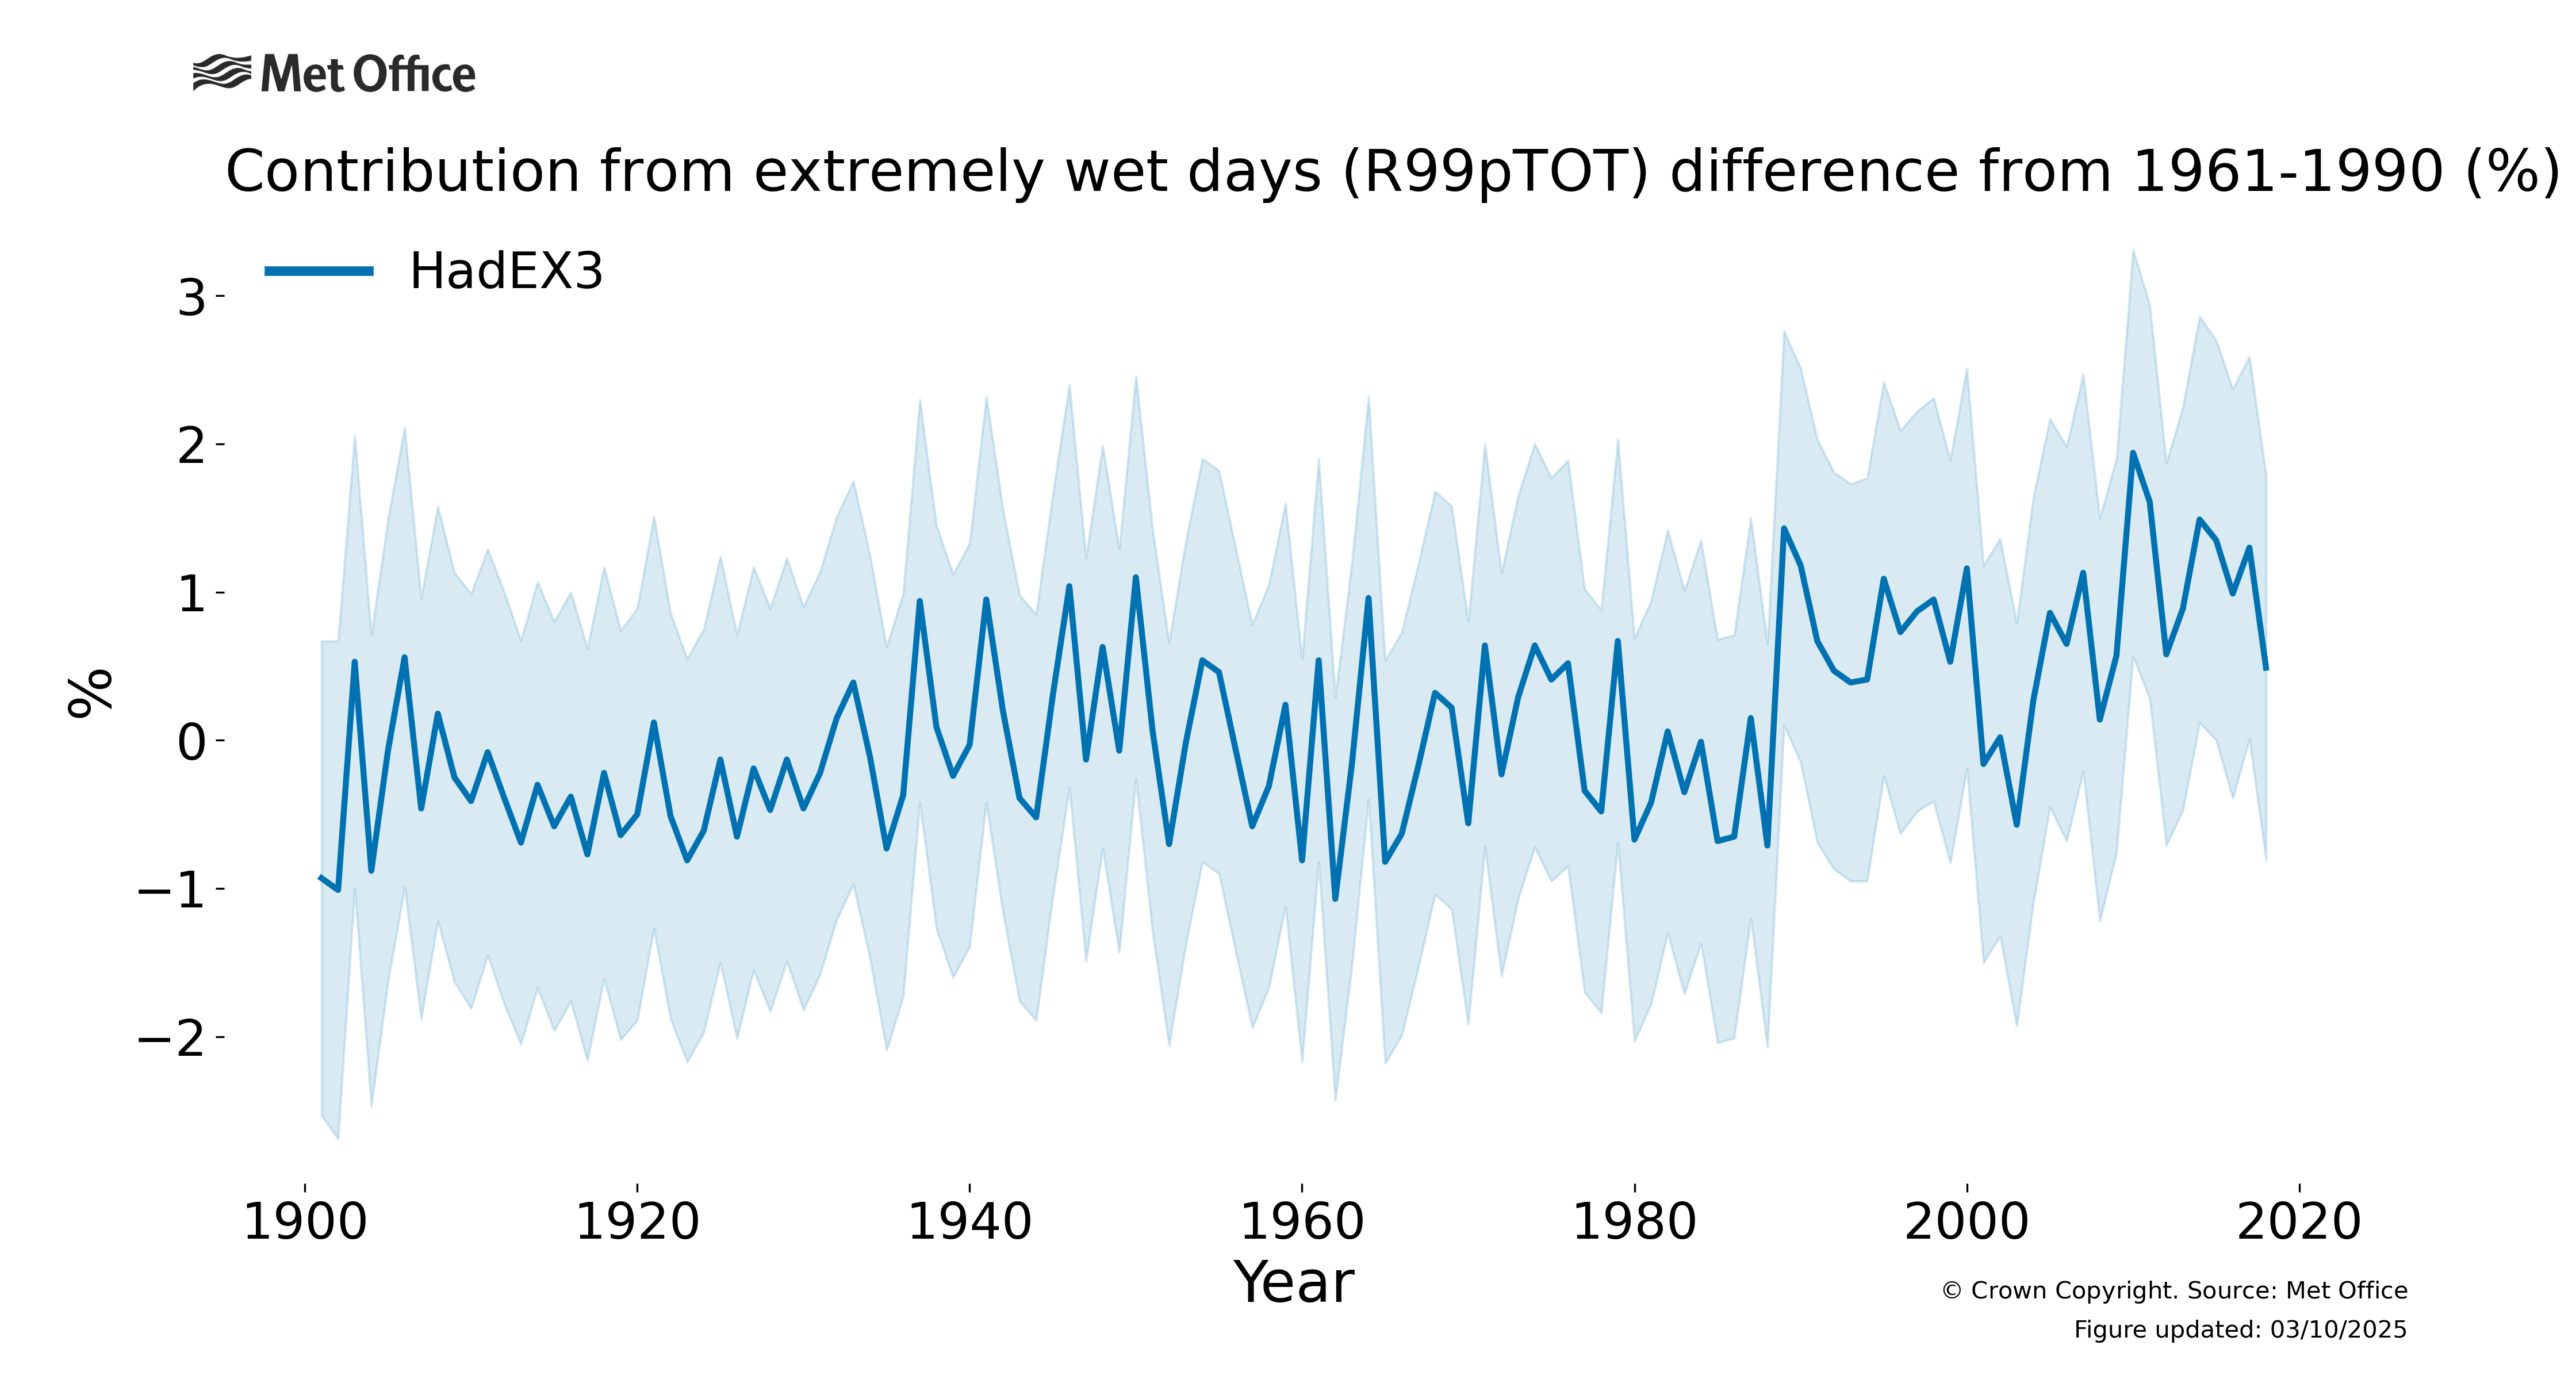
These three indices capture changes in intense rainfall by presenting the wettest day of the year, the amount of rain falling in heavy events and the fraction of the total annual precipitation coming from extremely heavy events. The single wettest day of the year is most likely to result in flash flooding. However, changes in all three indicators signal a change in the characteristics of heavy or intense rainfall.
In these indices, we can see how the wettest day (Rx1day) and the very wet days (R95p) are increasing. If there are more heavy rain days, then there is a greater likelihood that one of these days could cause flash flooding or other impacts related to run-off. And of course, if the heaviest rain day is getting wetter, then these impacts may also be getting worse.
How has extreme rainfall changed?
All three indices (the wettest day, the amount falling in heavy events and also the fraction these events contribute to the total) show gentle increases since the beginning of the 20th Century. As rainfall can be a much more localised phenomenon, and especially for convective events which are likely to result in the intense downpours assessed by these indices, there is a greater spatio-temporal variation in these indices. Therefore, the greater year-to-year variability compared to the temperature indices is expected.
On a global average, we see that on the wettest day in a year, a few more mm of rain will fall than in similar events 100 years ago. Over 20mm more rain is falling on the wettest days of the year than the average over 1961-90. Nowadays, an extra 2% of the total annual rainfall is falling in these wet days, compared to 1961-90.
How are the extreme rainfall indices defined?
The wettest day (Rx1day) shows the amount of rain that falls in the wettest 24hr period in any given year.
Using the distribution of wet days (at least 1mm) over 1961-90, a threshold can be calculated from the wettest 5% of days. The amount of rain that fell in days that are wetter than this threshold is captured by R95p, and the fraction that this represents of the total rainfall is R99ptot (=R99p/PRCPTOT). As the top 1% of wettest days are unlikely to contain 1% of the rainfall, this is a useful measure of how the distribution of rain falling in rainy days is changing.
Why has extreme rainfall changed?
The Intergovernmental Panel on Climate Change (IPCC) concluded in 2013 that “In land regions where observational coverage is sufficient for assessment, there is medium confidence that anthropogenic forcing has contributed to a global-scale intensification of heavy precipitation over the second half of the 20th century“.
The indices presented on this page measure the intensity of short term rainfall events (Rx1day) and properties of heavy rainfall events (R95p, R99ptot), and so changes in these may have come from the emission of greenhouse gases and other human activities with impacts on our climate.
Find out more?
More information on climate indices can be found at climdex.org.
HadEX3 was developed in collaboration between the Met Office, ARC Centre of Excellence for Climate Extremes at the University of New South Wales, Environment and Climate Change Canada and Barcelona Supercomputing Center. For a full list of contributors, please see the journal article and the main dataset webpage for HadEX3.
- HadEX3 – www.metoffice.gov.uk/hadobs/hadex3/ , www.climdex.org – https://doi.org/10.1029/2019JD032263 and https://hadex-extremes.blogspot.com/
- GHCNDEX – www.climdex.org, https://doi.org/10.1175/BAMS-D-12-00109.1


