Why is monitoring heatwaves important?
Heatwaves and “cold waves” are important as sometimes even if individual days are not that much warmer or cooler than average, a consecutive run of them will trigger heat health or cool weather health impacts. These indices capture some of the other characteristics of heatwaves, as defined by Perkins & Kirkpatrick (2013)
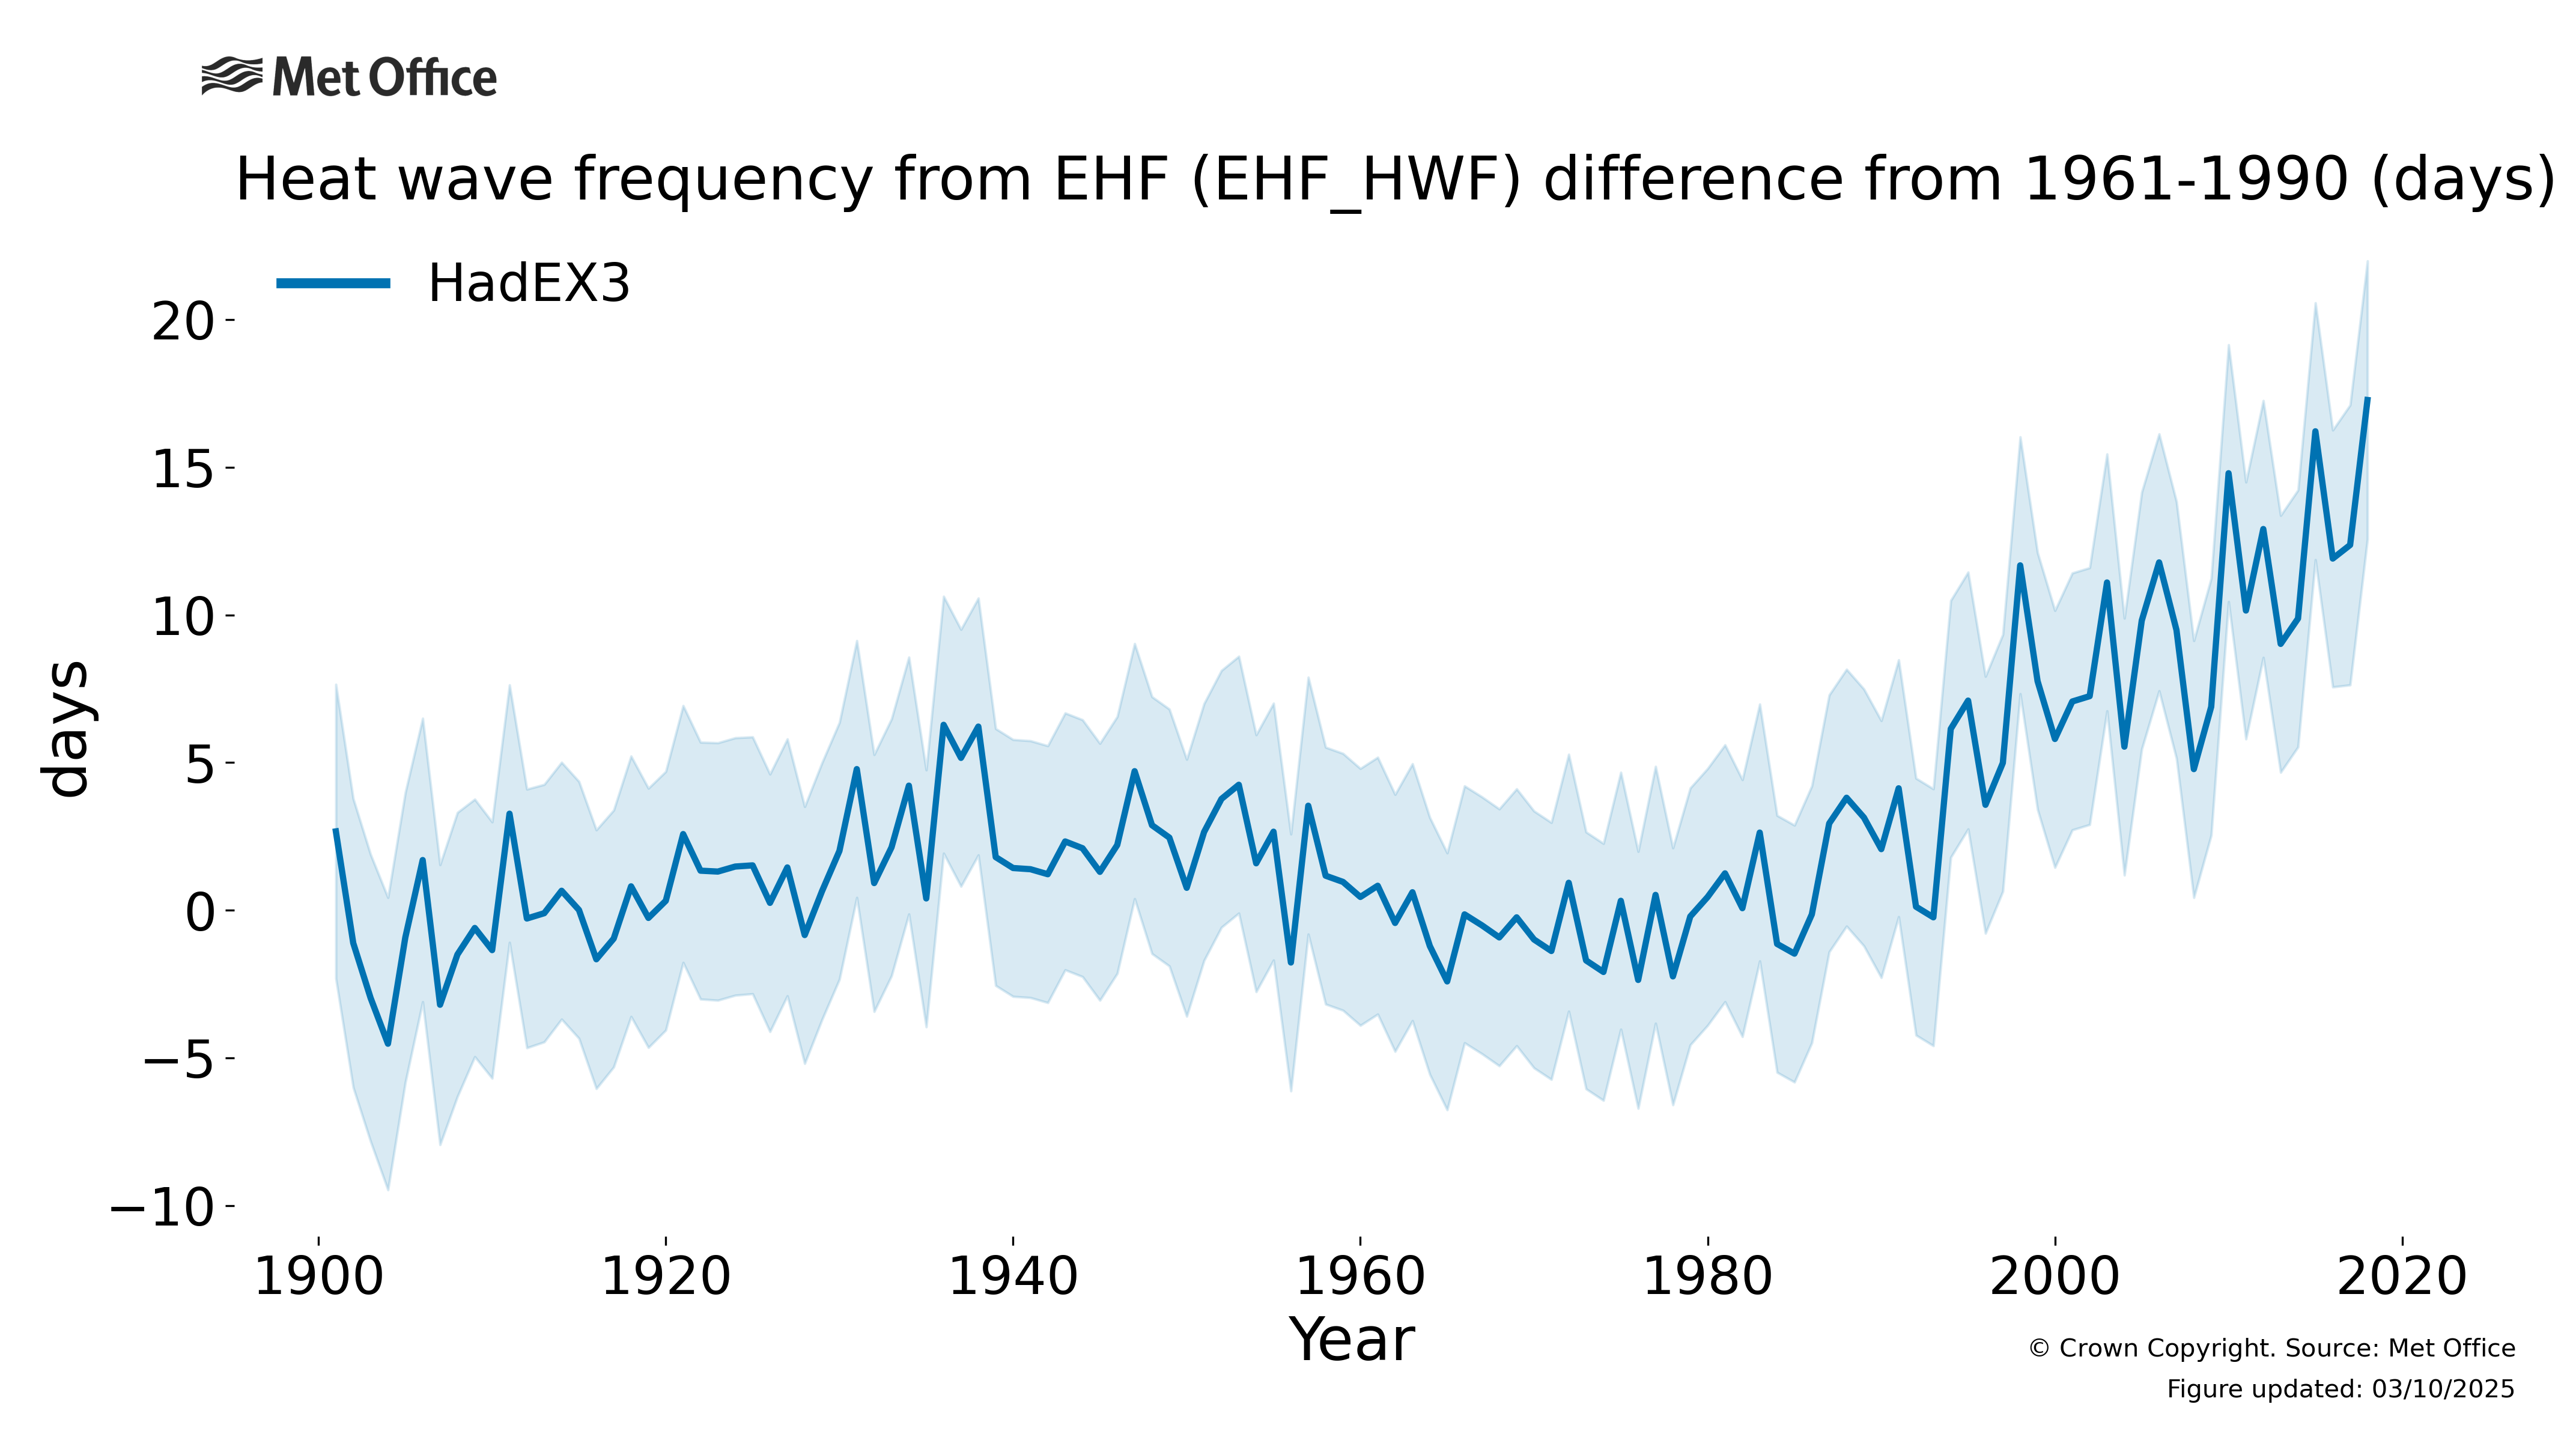
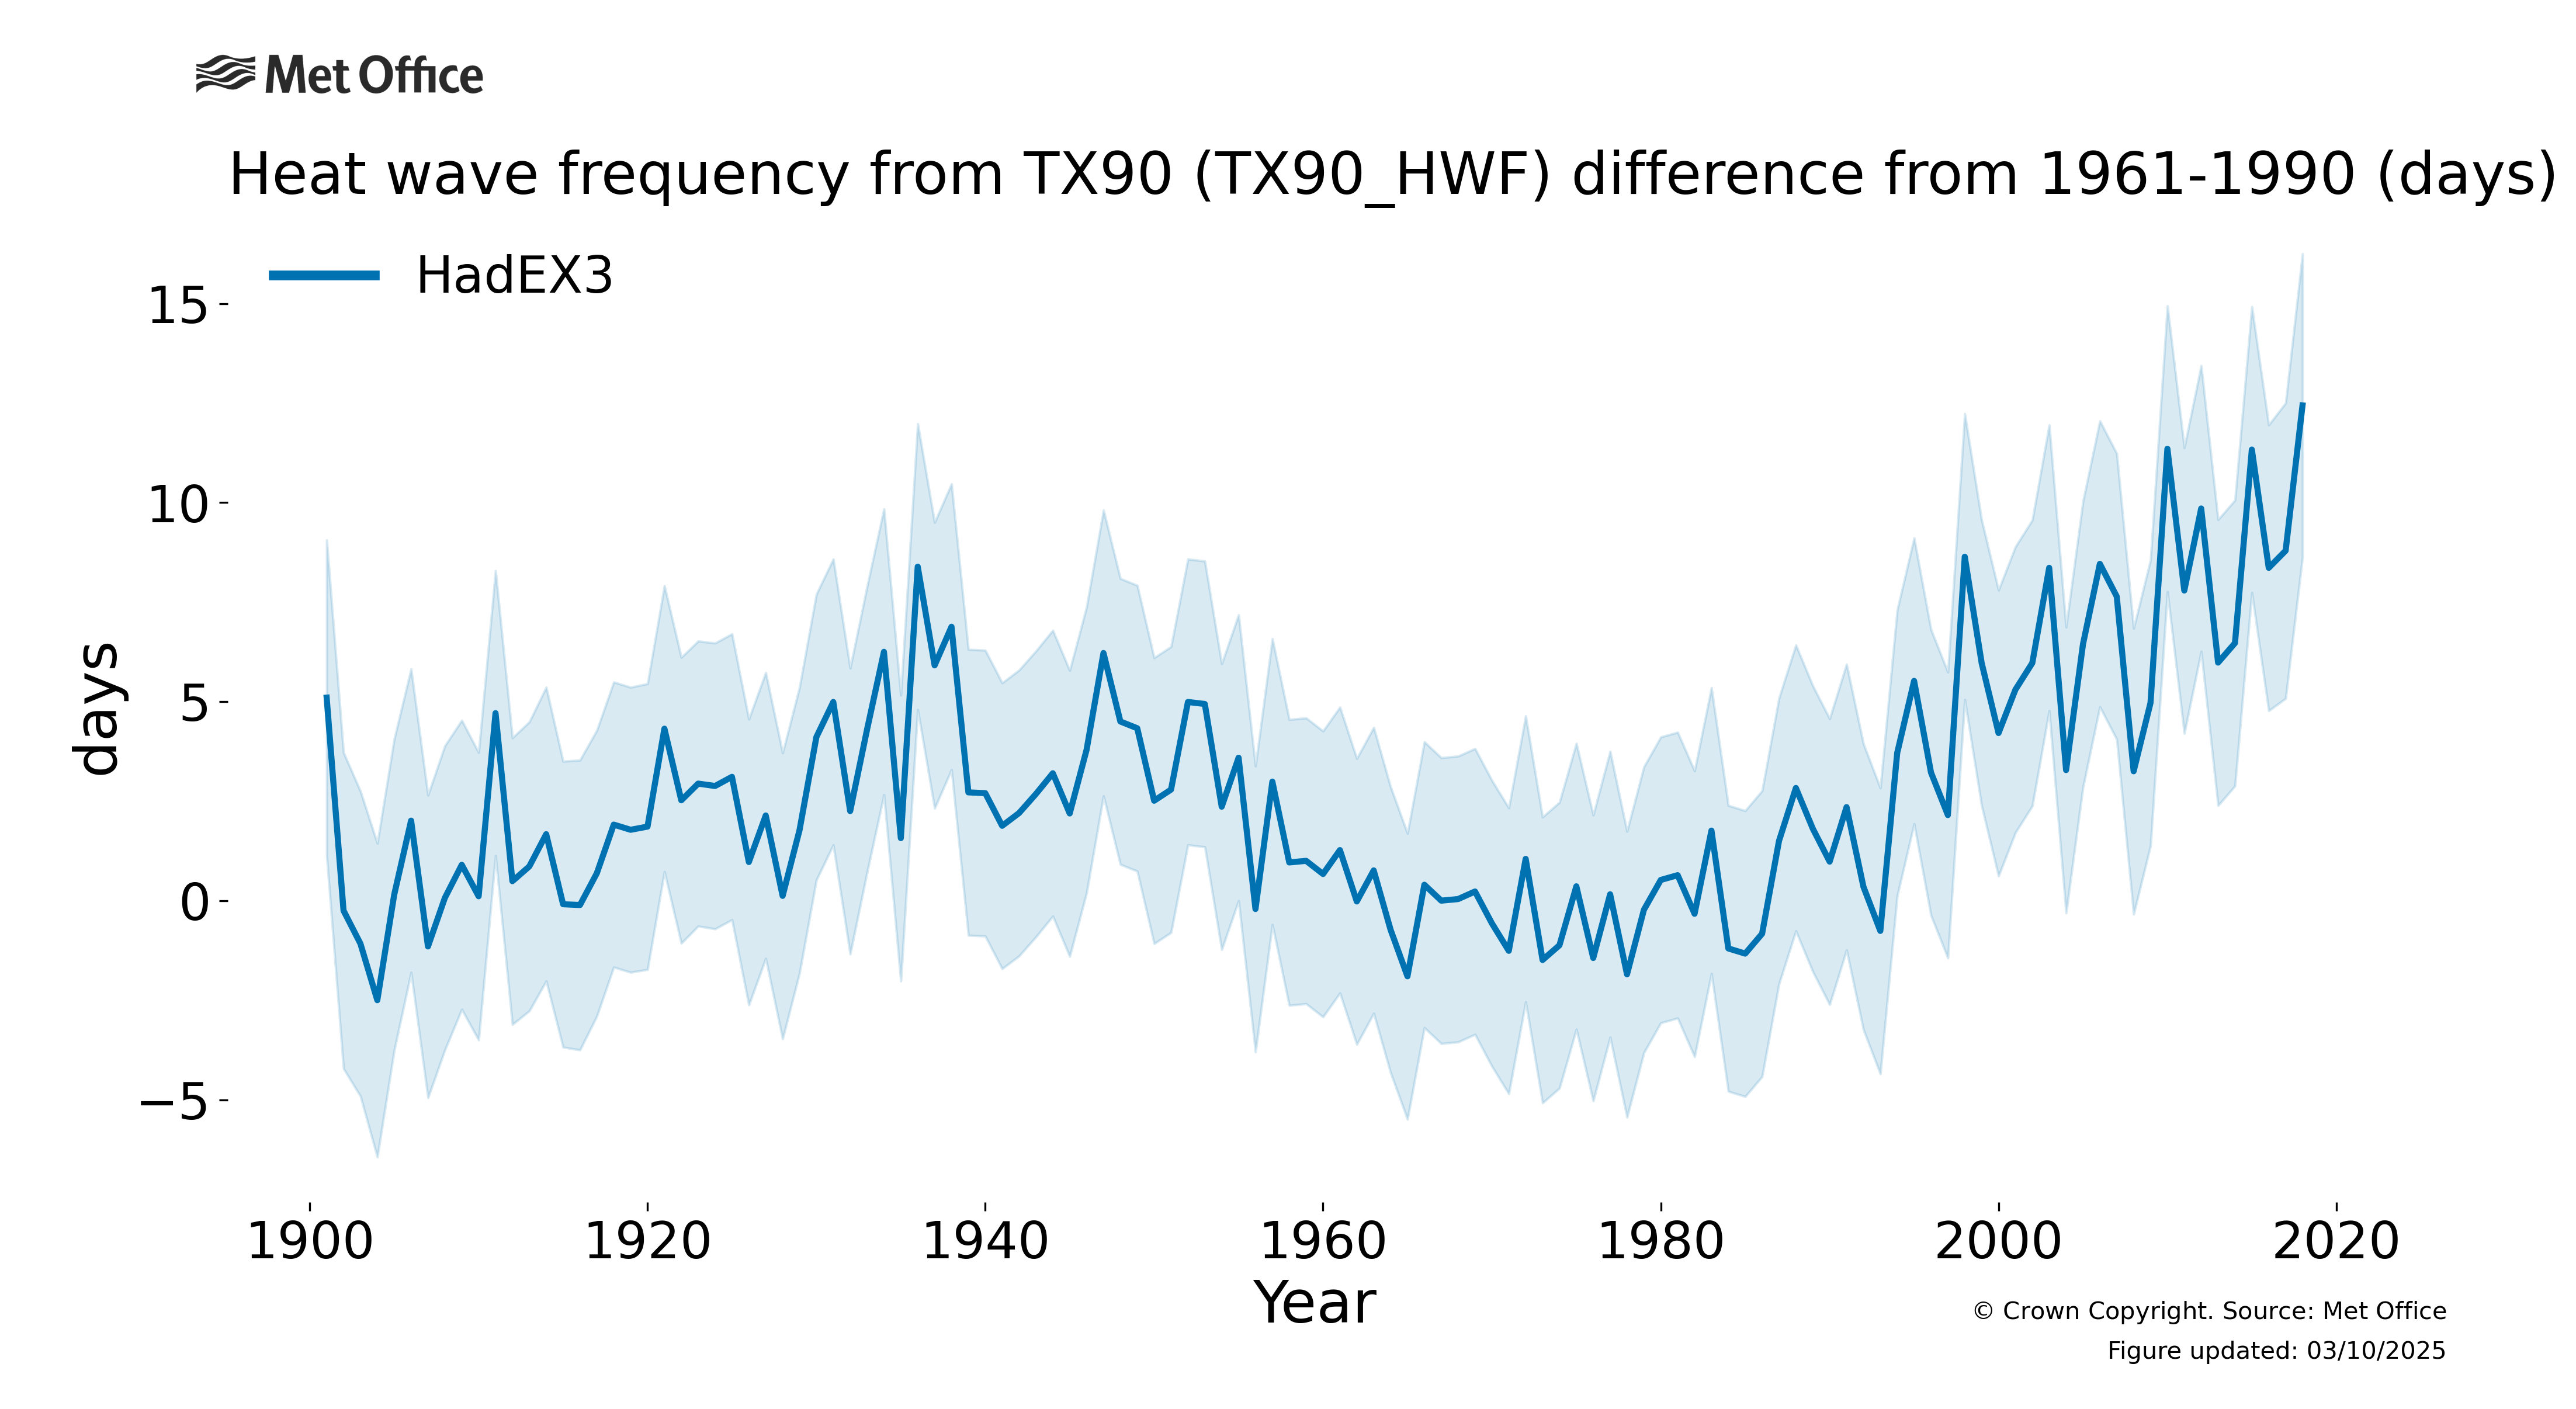
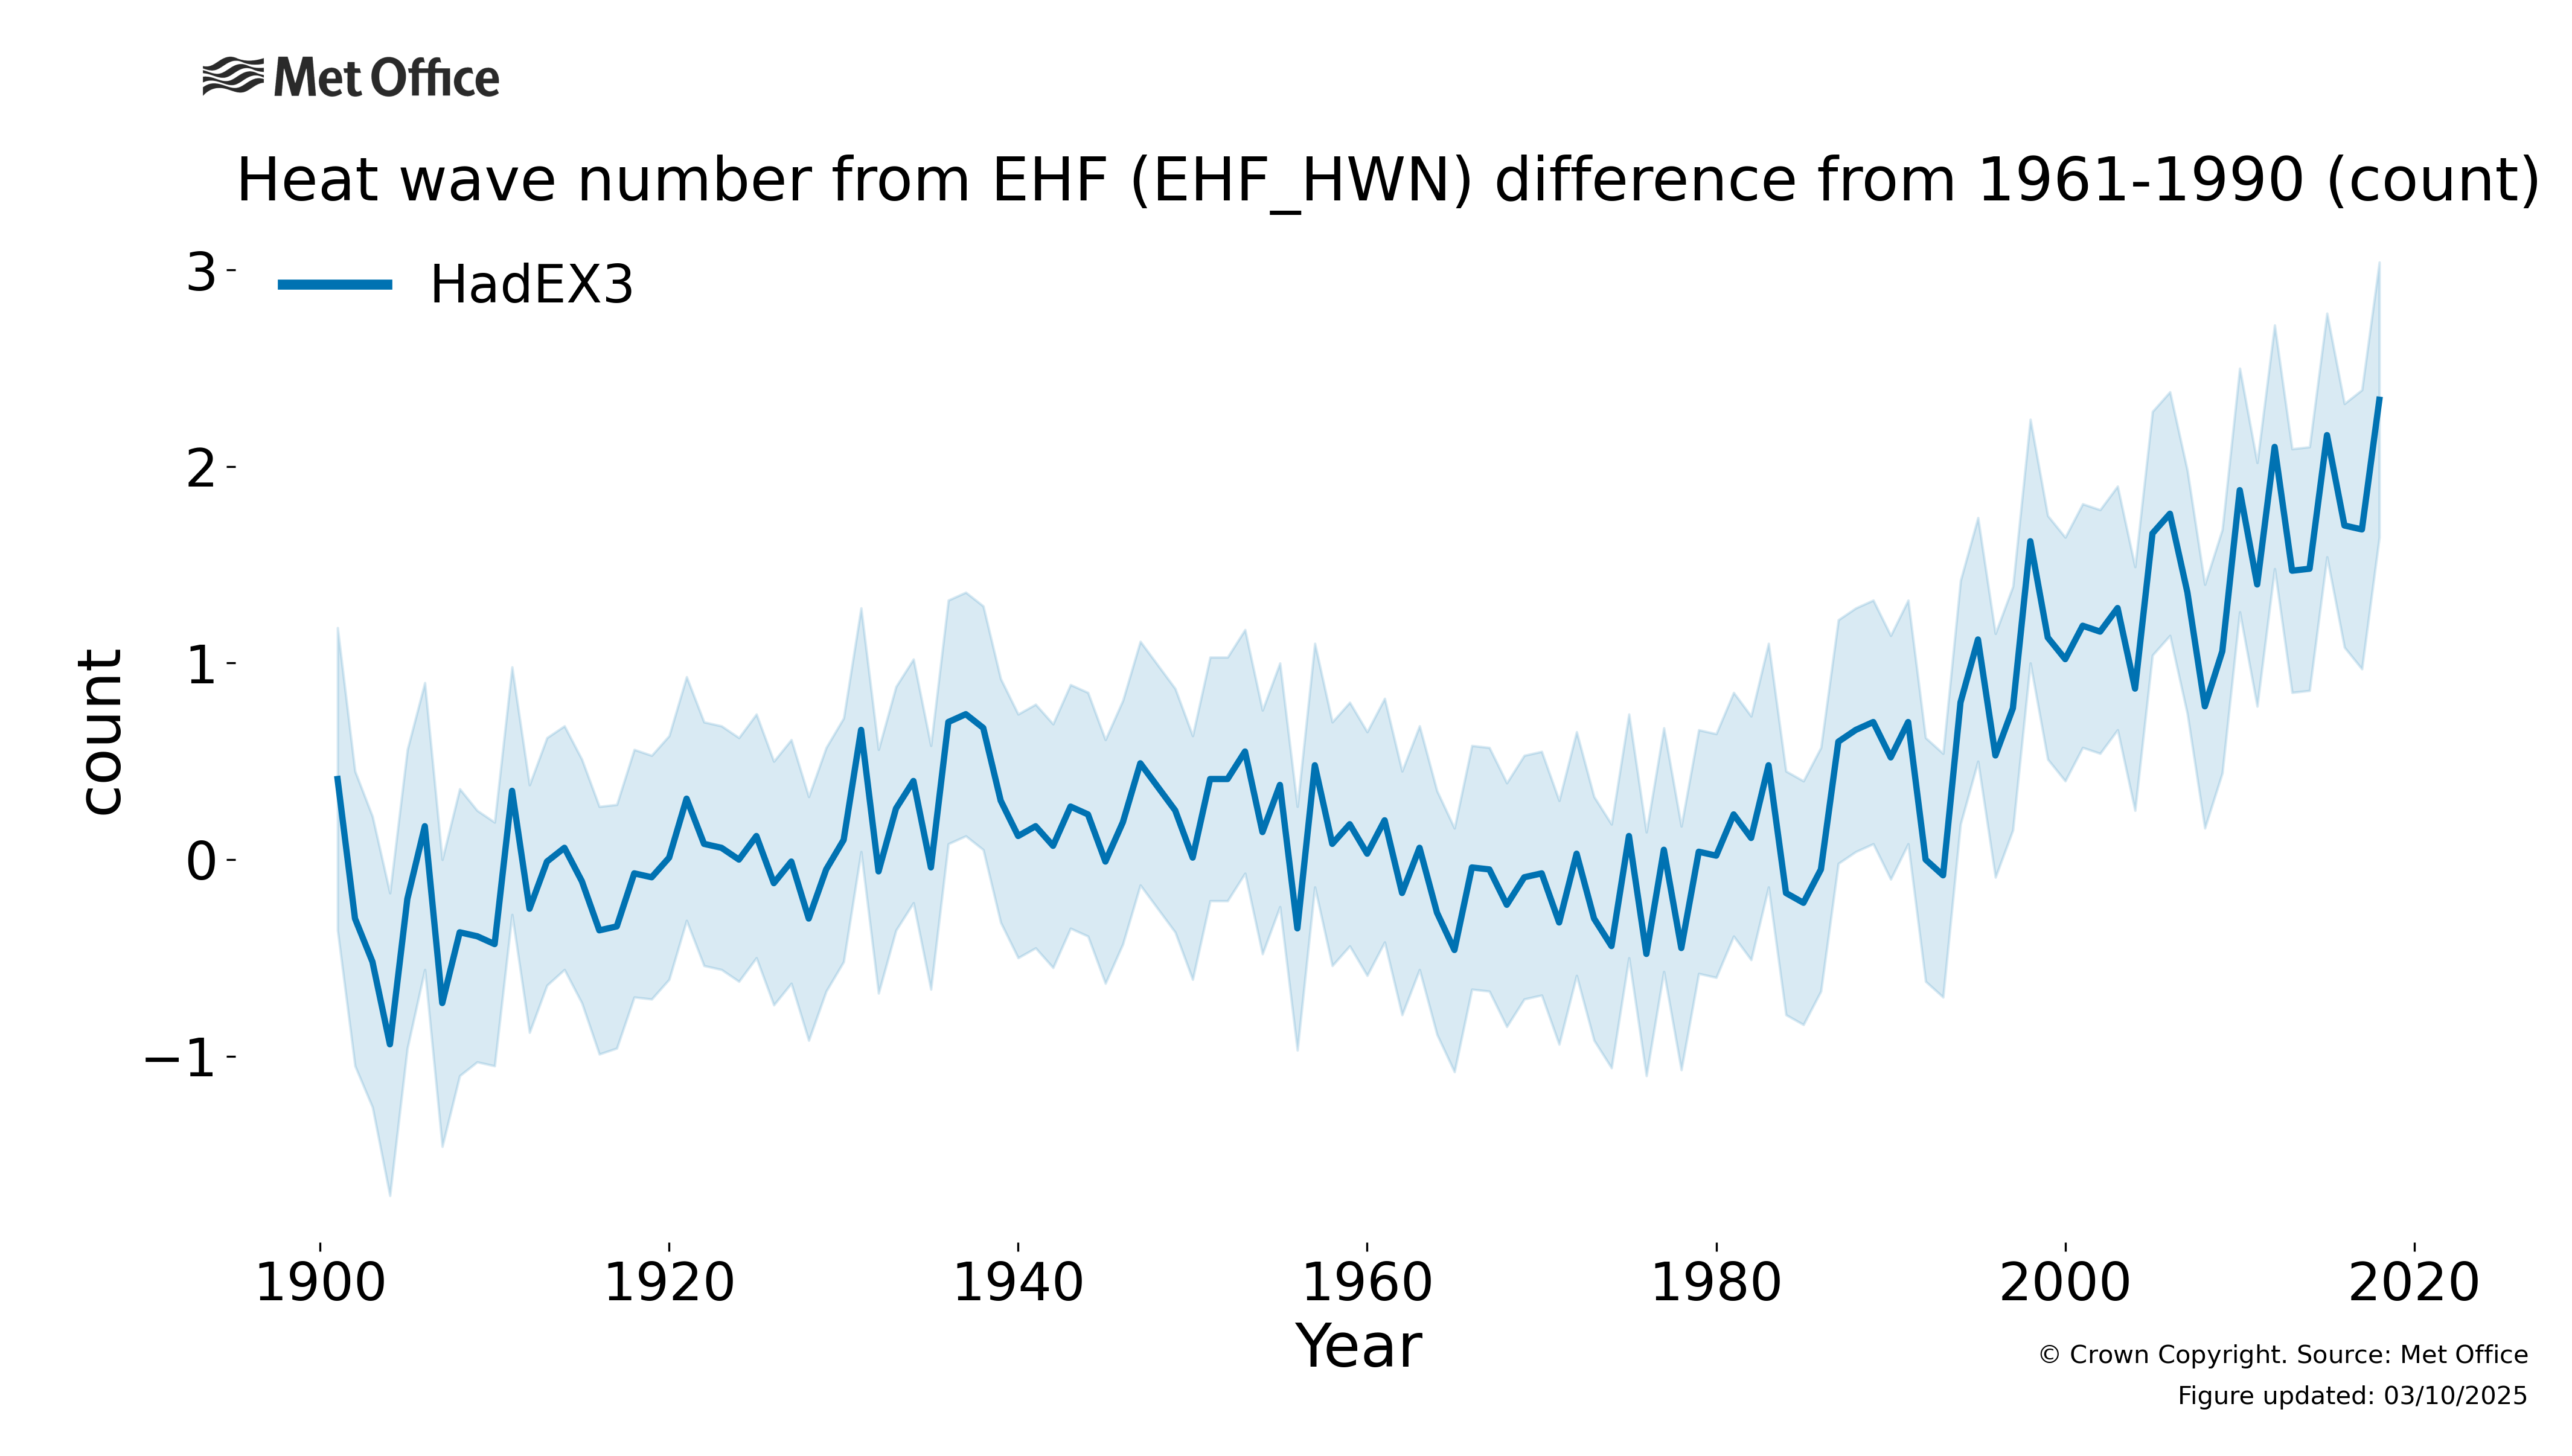
The indices shown here are for the heatwave frequency and number; the former is the number of all heatwave days in a year or season, the latter is the number of identified heatwaves. Alongside these, the amplitude is the hottest days of the event with the hottest average temperature, the duration is the length of the longest event, and magnitude is the average temperature across all events, but these are not shown here.
How have heatwave characteristics changed?
Both the number of heatwaves and number of days in heat wave events within a season have increased since the 1970s, in line with changes in other warm temperature extremes. The minor peak in these indices in the 1930s is linked to the Dust Bowl of the American mid-west. This multi-year event stands out comparatively prominently because the spatial coverage of the dataset during this period is predominantly limited to North America, Europe and some parts of Australia.
How are the heatwave indices defined?
The heatwave frequency indices (EHF_HWF and TX90_HWF) capture the total number of days which occurred in identified heatwave events. The heatwave number index (EHF_HWN) counts the total number of heatwave events within a year. Days which contribute towards heatwave events are determined using either the Excess Heat Factor (Nairn et al, 2009) or using days where the maximum temperature exceeds the 90th percentile as calculated over 1961-1990.
The Excess Heat Factor is itself based on two indices, the first comparing the previous three days temperatures to the 30 days before that, and the second compares the three days to the 95th percentile value (used as a threshold of extremity). The inclusion of the prior two days accounts for some acclimatisation to above-average temperatures that may occur over that period.
Why have heatwave characteristics changed?
The Intergovernmental Panel on Climate Change (IPCC) concluded in 2013 that “It is very likely that anthropogenic forcing has contributed to the observed changes in the frequency and intensity of daily temperature extremes on the global scale since the mid-20th century.” They also said that “it is likely that human influence has substantially increased the probability of occurrence of heatwaves in some locations.” There was not enough evidence at the time to attrubute changes in the duration of heatwaves to human activities.
Find out more?
Nairn, J., R. Fawcett, and D. Ray, 2009: Defining and predicting excessive heat events: A national system. CAWCR Tech. Rep. 017, 83-86 Perkins, S. E., and L. V. Alexander, 2013: On the Measurement of Heat Waves. J. Climate, 26, 4500-4517, https://doi.org/10.1175/JCLI-D-12-00383.1.
More information on climate indices can be found at climdex.org.
HadEX3 was developed in collaboration between the Met Office, ARC Centre of Excellence for Climate Extremes at the University of New South Wales, Environment and Climate Change Canada and Barcelona Supercomputing Center. For a full list of contributors, please see the journal article and the main dataset webpage for HadEX3.
- HadEX3 – www.metoffice.gov.uk/hadobs/hadex3/ , www.climdex.org – https://doi.org/10.1029/2019JD032263 and https://hadex-extremes.blogspot.com/
- GHCNDEX – www.climdex.org, https://doi.org/10.1175/BAMS-D-12-00109.1


