Tracking Extremes in a Changing Climate
Global Climate Extremes Dashboard
In this dashboard we present global indices related to extremes:
- HadEX3 and GHCNDEX moderate temperature and precipitation extremes calculated from historical observations of temperature and rainfall;
- HadISDH.extremes humid-heat extremes indices based on historical observations of wet-bulb temperature.
Looking at the changing climate by studying the frequency, duration and intensity of extreme weather events, complements other metrics such as annual average temperature rise. It is often through extreme weather events that impacts from climate change affect us, and these kinds of events can present the greatest shocks to human health and wellbeing, economies and the biosphere.
One of the indices showing the most dramatic change over time is the increase in the number of warm days, which is derived from changes in the daily maximum temperature. At the same time, the number of cold nights has decreased, marking a shift in the whole distribution of daily temperatures. Similarly, number of warm-humid days have increased, while cool-fresh days have decreased.
Rainfall tends to be more variable than temperature - a cloudburst might fall on a single village and last twenty minutes; a heatwave will typically affect the whole region - so the trends are less clear. However, there is an increasing contribution to total annual rainfall from very wet days, with an extra two per cent of precipitation falling on these days compared to 1961-90.
These extremes indices are based on measurements of air temperature, wet-bulb temperature and precipitation, made at weather stations around the world, using standardised scientific equipment to ensure that the readings are as accurate as possible.
One difficulty of assessing extremes is getting hold of the data. The calculations use hourly or daily data, which is not freely shared by all countries because of its commercial value. Some Meteorological services use this to fund their national measuring networks. Initiatives led by the former WMO Expert Team on Climate Change Detection and Indices have worked with countries to calculate and share the indices.
The front page shows the main indicators. Beneath each one there is additional detail, drilling down into why the indicator is important, how it has changed and how it was calculated. The pages also link through to the data so that you can explore for yourself. Further indicators are available through the menu in the top left of each page.
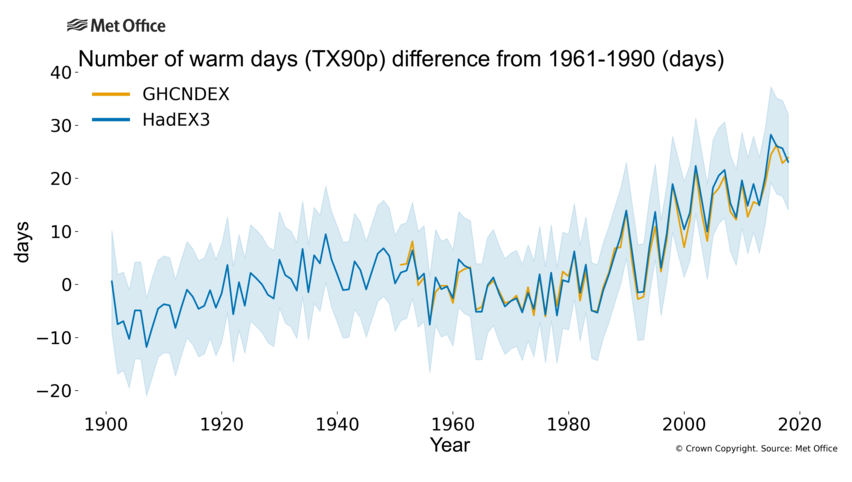
Warm days
Warm days are becoming more frequent
Changes in the extreme high temperature indices are widespread and consistent with global-scale warming.

Cold nights
Cold nights are becoming less frequent
The frequency of extremes related to low daily minimum temperatures is declining.
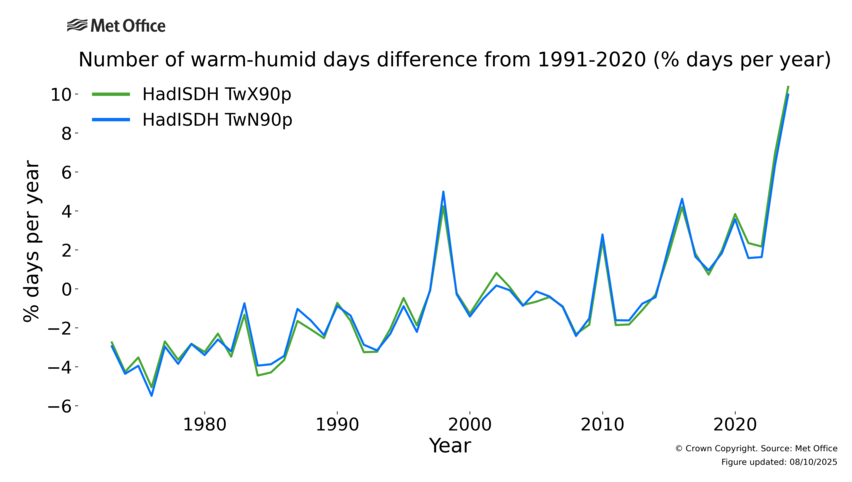
Warm-humid days
Humid-heat days are becoming more frequent
Changes in extreme humid-heat are widespread and consistent with global-scale warming.
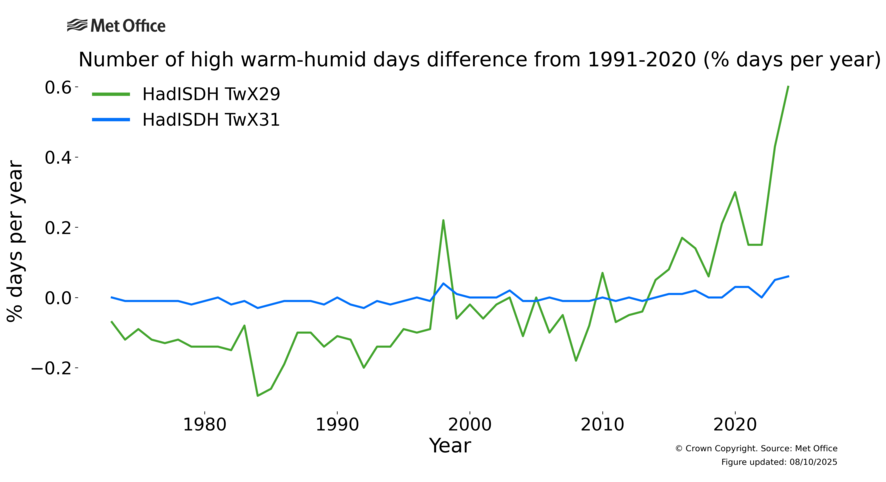
Very high to severe humid heat days
Very high to severe humid-heat days are becoming more frequent.
Many regions are experiencing days above humid-heat thresholds that are considered to be moderately-high, high, very high and severe.
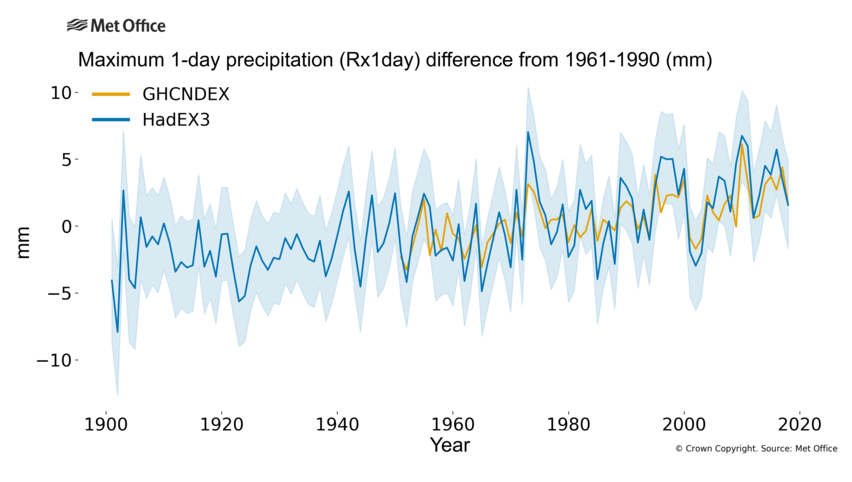
Precipitation intensity
Intense rainfall is increasing
The wettest day of the year is getting wetter.
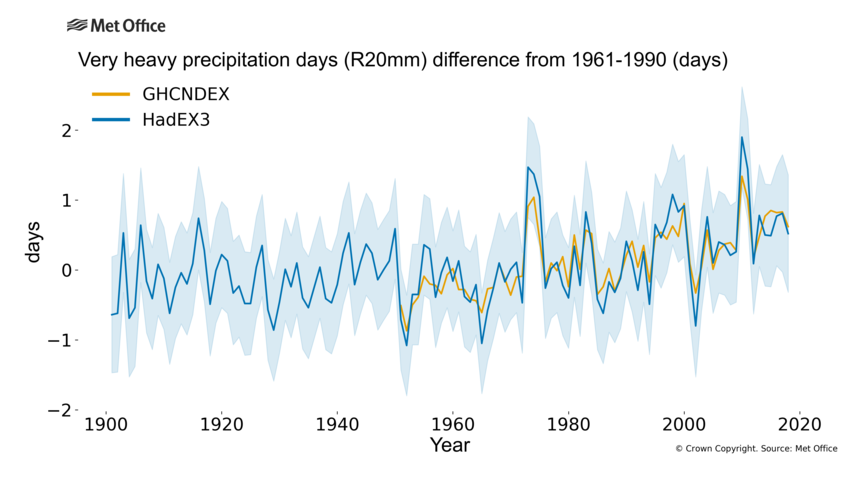
Extreme precipitation
Very wet days are contributing more rain
A greater proportion of annual rainfall is falling in heavy rainfall events.