Why are humid-heat extremes important?
Days and nights of unusually high temperatures can have widespread impacts on people, animals and plants. Additionally, the level of moisture in the air can act as a compounding factor, making high temperature heat events harder to deal with physiologically. Higher levels of humidity can also make more moderate temperature events, which wouldn’t necessarily trigger a severe weather warning, physiologically difficult.
This is because the amount of moisture in the air directly affects the ability of humans (and animals) to offload heat and keep cool. The air closest to our skin must remain below 100 %rh relative humidity for sweat to evaporate away and cool our bodies. The closer the air is to saturation (100 %rh relative humidity), the less effective sweating (and panting for many animals) is. We feel this effect on ‘muggy’ days and it can make any physically or even mentally demanding task feel more difficult and tiring than normal.
The wet-bulb temperature is a measure of the evaporative cooling capacity of the air. To measure it, a thermometer bulb is covered in a wetted material (connected to a reservoir of water). When the air is below saturation (<100 %rh relative humidity), evaporation of that water cools the thermometer such that its temperature reading is lower than a dry-bulb counterpart. The lower the wet-bulb temperature compared to the dry-bulb temperature, the lower the relative humidity. When relative humidity is 100 %rh the air is saturated – it is holding as much moisture as possible at that temperature. In this case the wet-bulb temperature will be equal to that of the dry-bulb temperature.
Human skin temperature is normally around 35 °C. Should the wet-bulb temperature reach 35 °C, this means that the air close to our skin is at 100 %rh and sweating becomes ineffective. Hence, a wet-bulb temperature of 35 °C represents an upper limit at which humans cannot survive for very long because of overheating. In practice, lower wet-bulb temperatures closer to 30 °C present dangerous health conditions because of the restricted ability to offload heat from the body.
Such extreme wet-bulb temperatures do occur, although at present they are rare and short-lived. Parts of the Tropics can experience daily maximum wet-bulb temperatures above 25 °C almost everyday, and above 29 °C on a few days per year. In contrast, over the UK and most of the mid-latitudes, 25 °C may only be exceeded on a couple of days per year or fewer. The 29 °C threshold is exceptionally rare and has not yet been exceeded over the UK.
How have humid-heat extremes changed?
Since global monitoring began in the 1970s, there has been an increase in both the frequency and intensity of humid-heat days across the globe. The annual median of the global daily maximum wet-bulb temperature (TwXx) has increased by almost 0.7 °C over that time, while the global mean number of days per year where the maximum wet-bulb temperature exceeded a local 90th percentile (TwX90p) has increased by ~28 days. Trends show increases in intensity and frequency almost everywhere over the observed global land, noting large data-gaps over Africa, South America and central Australia.
The annual median of the global daily minimum wet-bulb temperature (TwNn) has also increased over this time by 0.9 °C. This is at a slightly faster rate than the daily maximum. The global mean number of cool-fresh days per year, where the daily minimum wet-bulb temperature was lower than the local 10th percentile (TwN10p), has decreased by around 31 days. These trends are also near ubiquitous across the globe, noting large data-gaps over Africa, South America and central Australia.
How are the humid-heat indices defined?
Humid-heat intensity is defined by the maximum of the daily maximum wet-bulb temperature over the month (TwXx) and the minimum of the daily minimum wet-bulb temperature over the month (TwNn). The median is used when averaging over space and time. TwXx represents the most extreme humid-heat whereas TwNn represents the coolest-freshest days. During summer months cooler-fresher days may provide some respite from heat events so an increase in TwNn could infer fewer days where there is no / minimal physiological heat-stress.
Humid-heat frequency is defined by the number of days per month where the daily maximum wet-bulb temperature exceeds the local daily 90th percentile (TwX90p) or the daily minimum wet-bulb temperature exceeds the local daily 90th percentile (TwN90p). The mean is used when averaging over space and the sum is used when averaging over time.
Cool-fresh day frequency is defined by the number of days per month where the daily maximum wet-bulb temperature is lower than the local daily 10th percentile (TwX10p) or the daily minimum wet-bulb temperature is lower than the local daily 10th percentile (TwN10p). The mean is used when averaging over space and the sum is used when averaging over time. During summer months cooler-fresher days may provide some respite from heat events so a decrease in these indices could infer fewer days where there is no / minimal physiological heat-stress.
Humid-heat extreme threshold exceedance is defined in 6 categories:
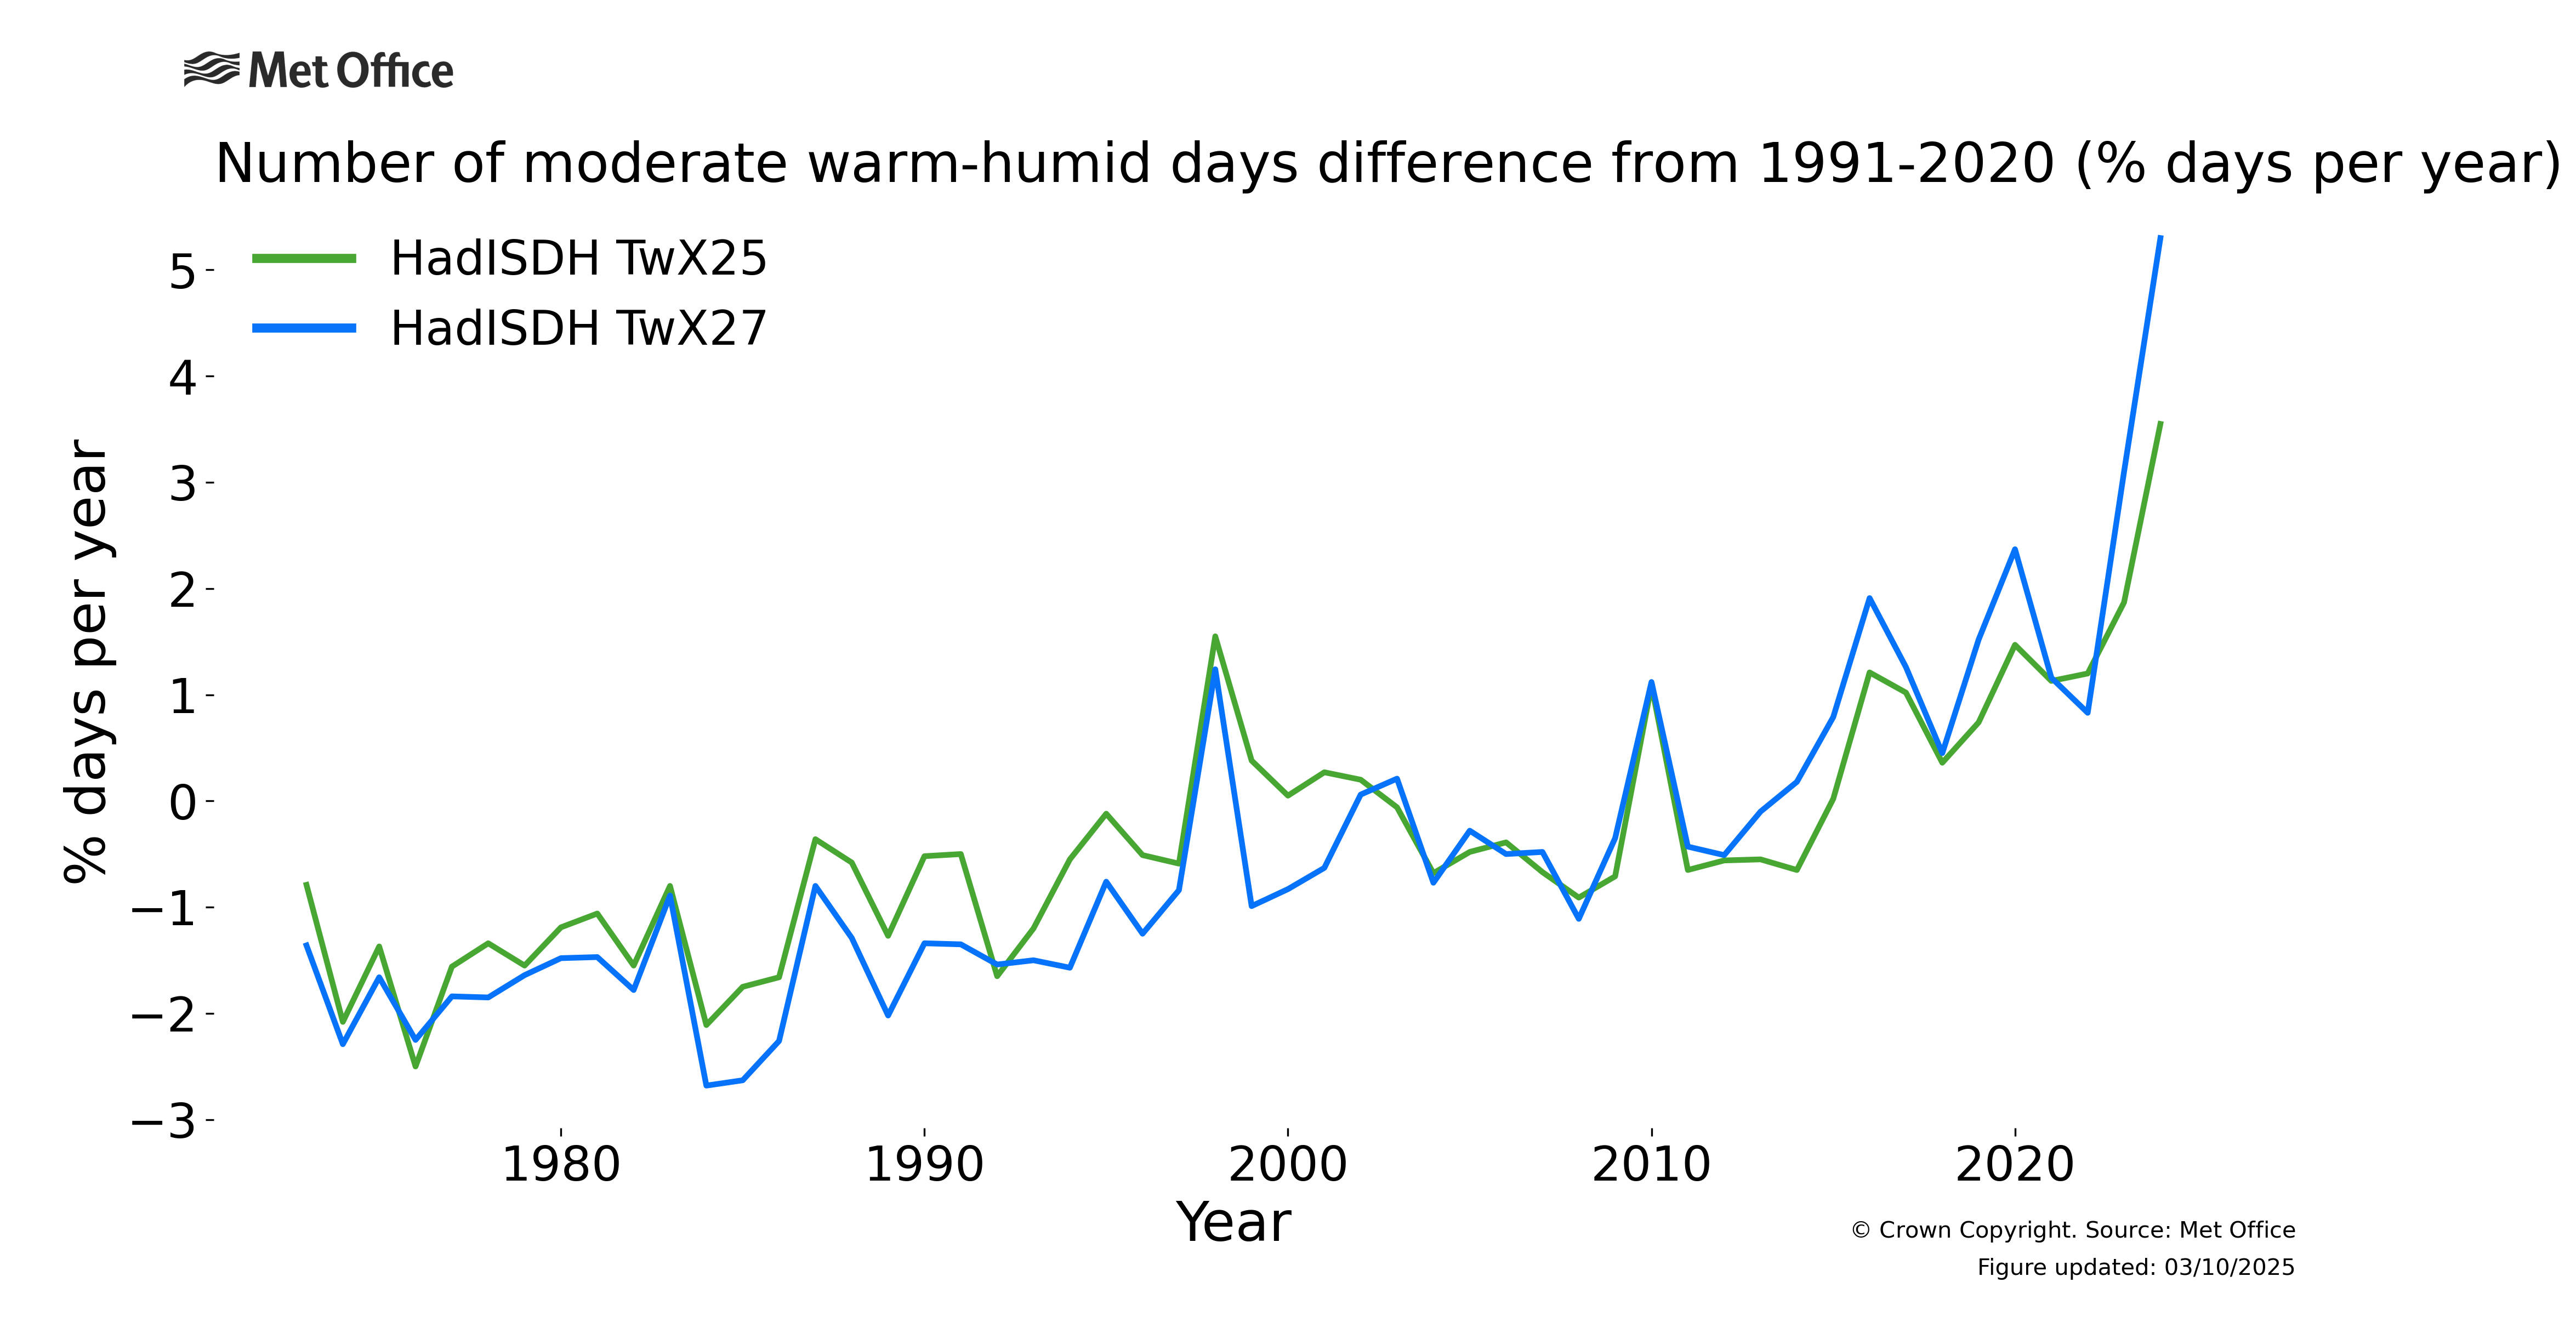
- Moderately high humid-heat days (TwX25) are defined as the number of days per month where the daily maximum wet-bulb temperature is equal to or exceeds 25 °C;
- High humid-heat days (TwX27) are defined as the number of days per month where the daily maximum wet-bulb temperature is equal to or exceeds 27 °C;
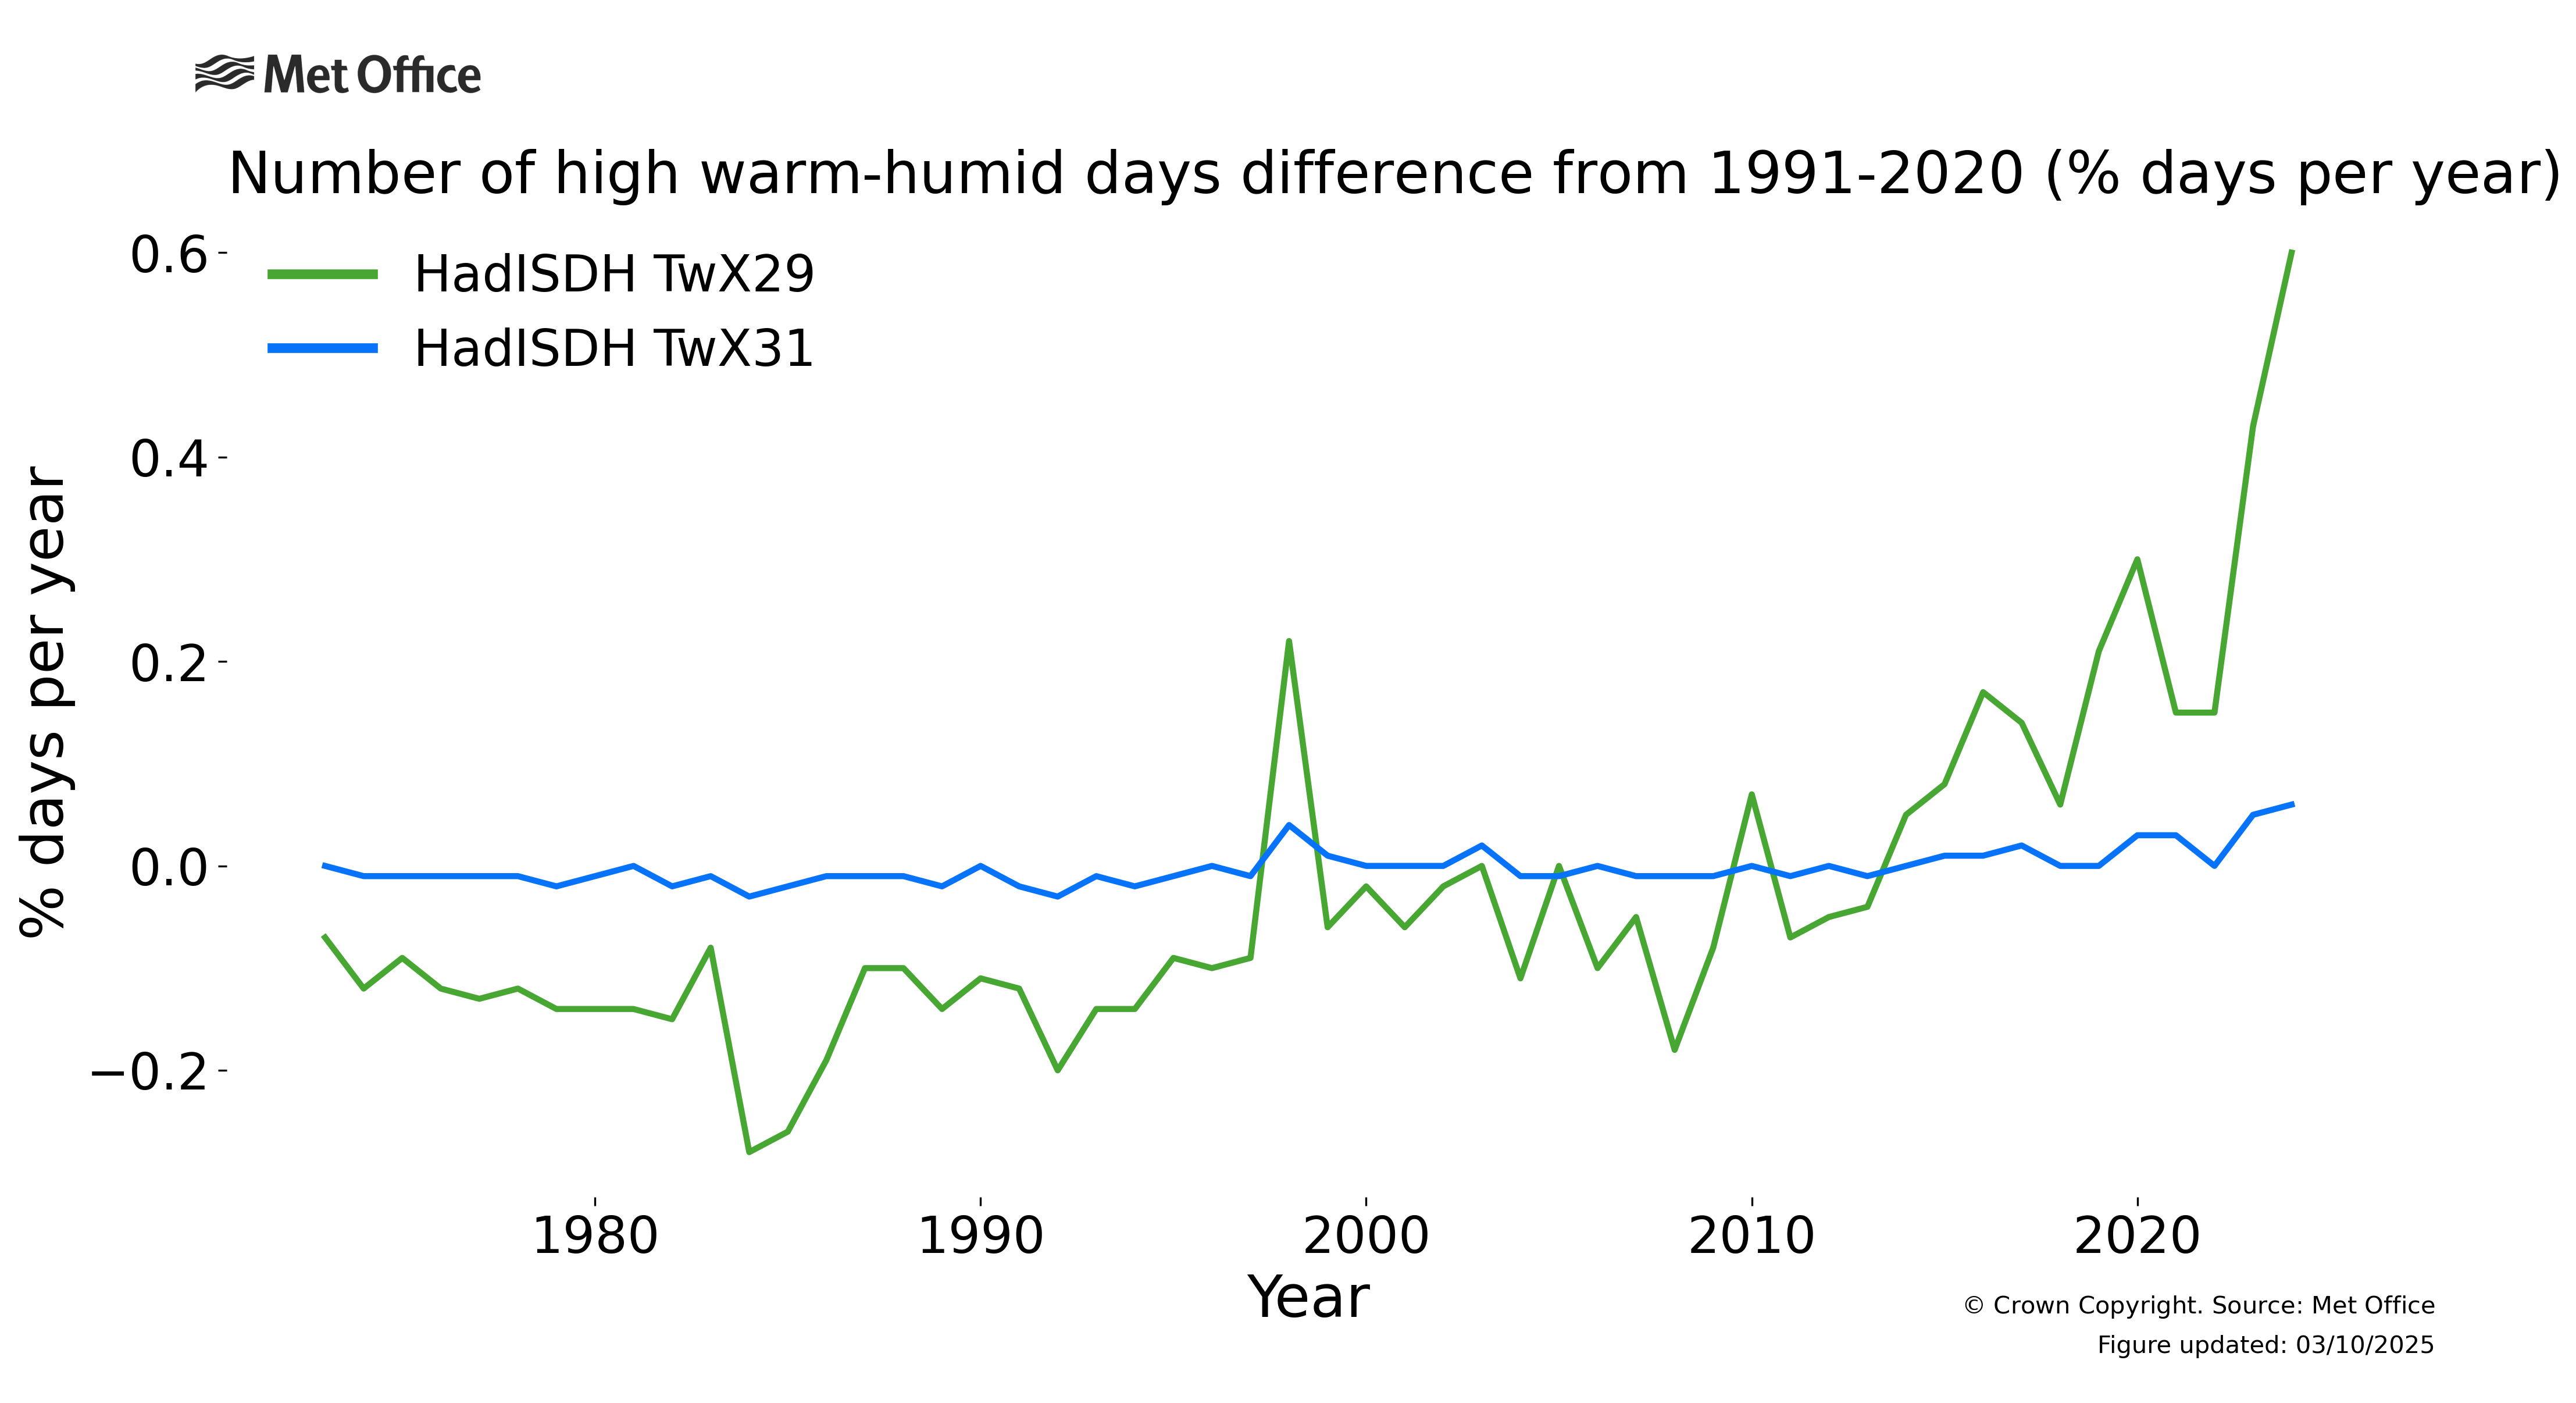
- Very high humid-heat days (TwX29) are defined as the number of days per month where the daily maximum wet-bulb temperature is equal to or exceeds 29 °C;
- Severe humid-heat days (TwX31) are defined as the number of days per month where the daily maximum wet-bulb temperature is equal to or exceeds 31 °C;
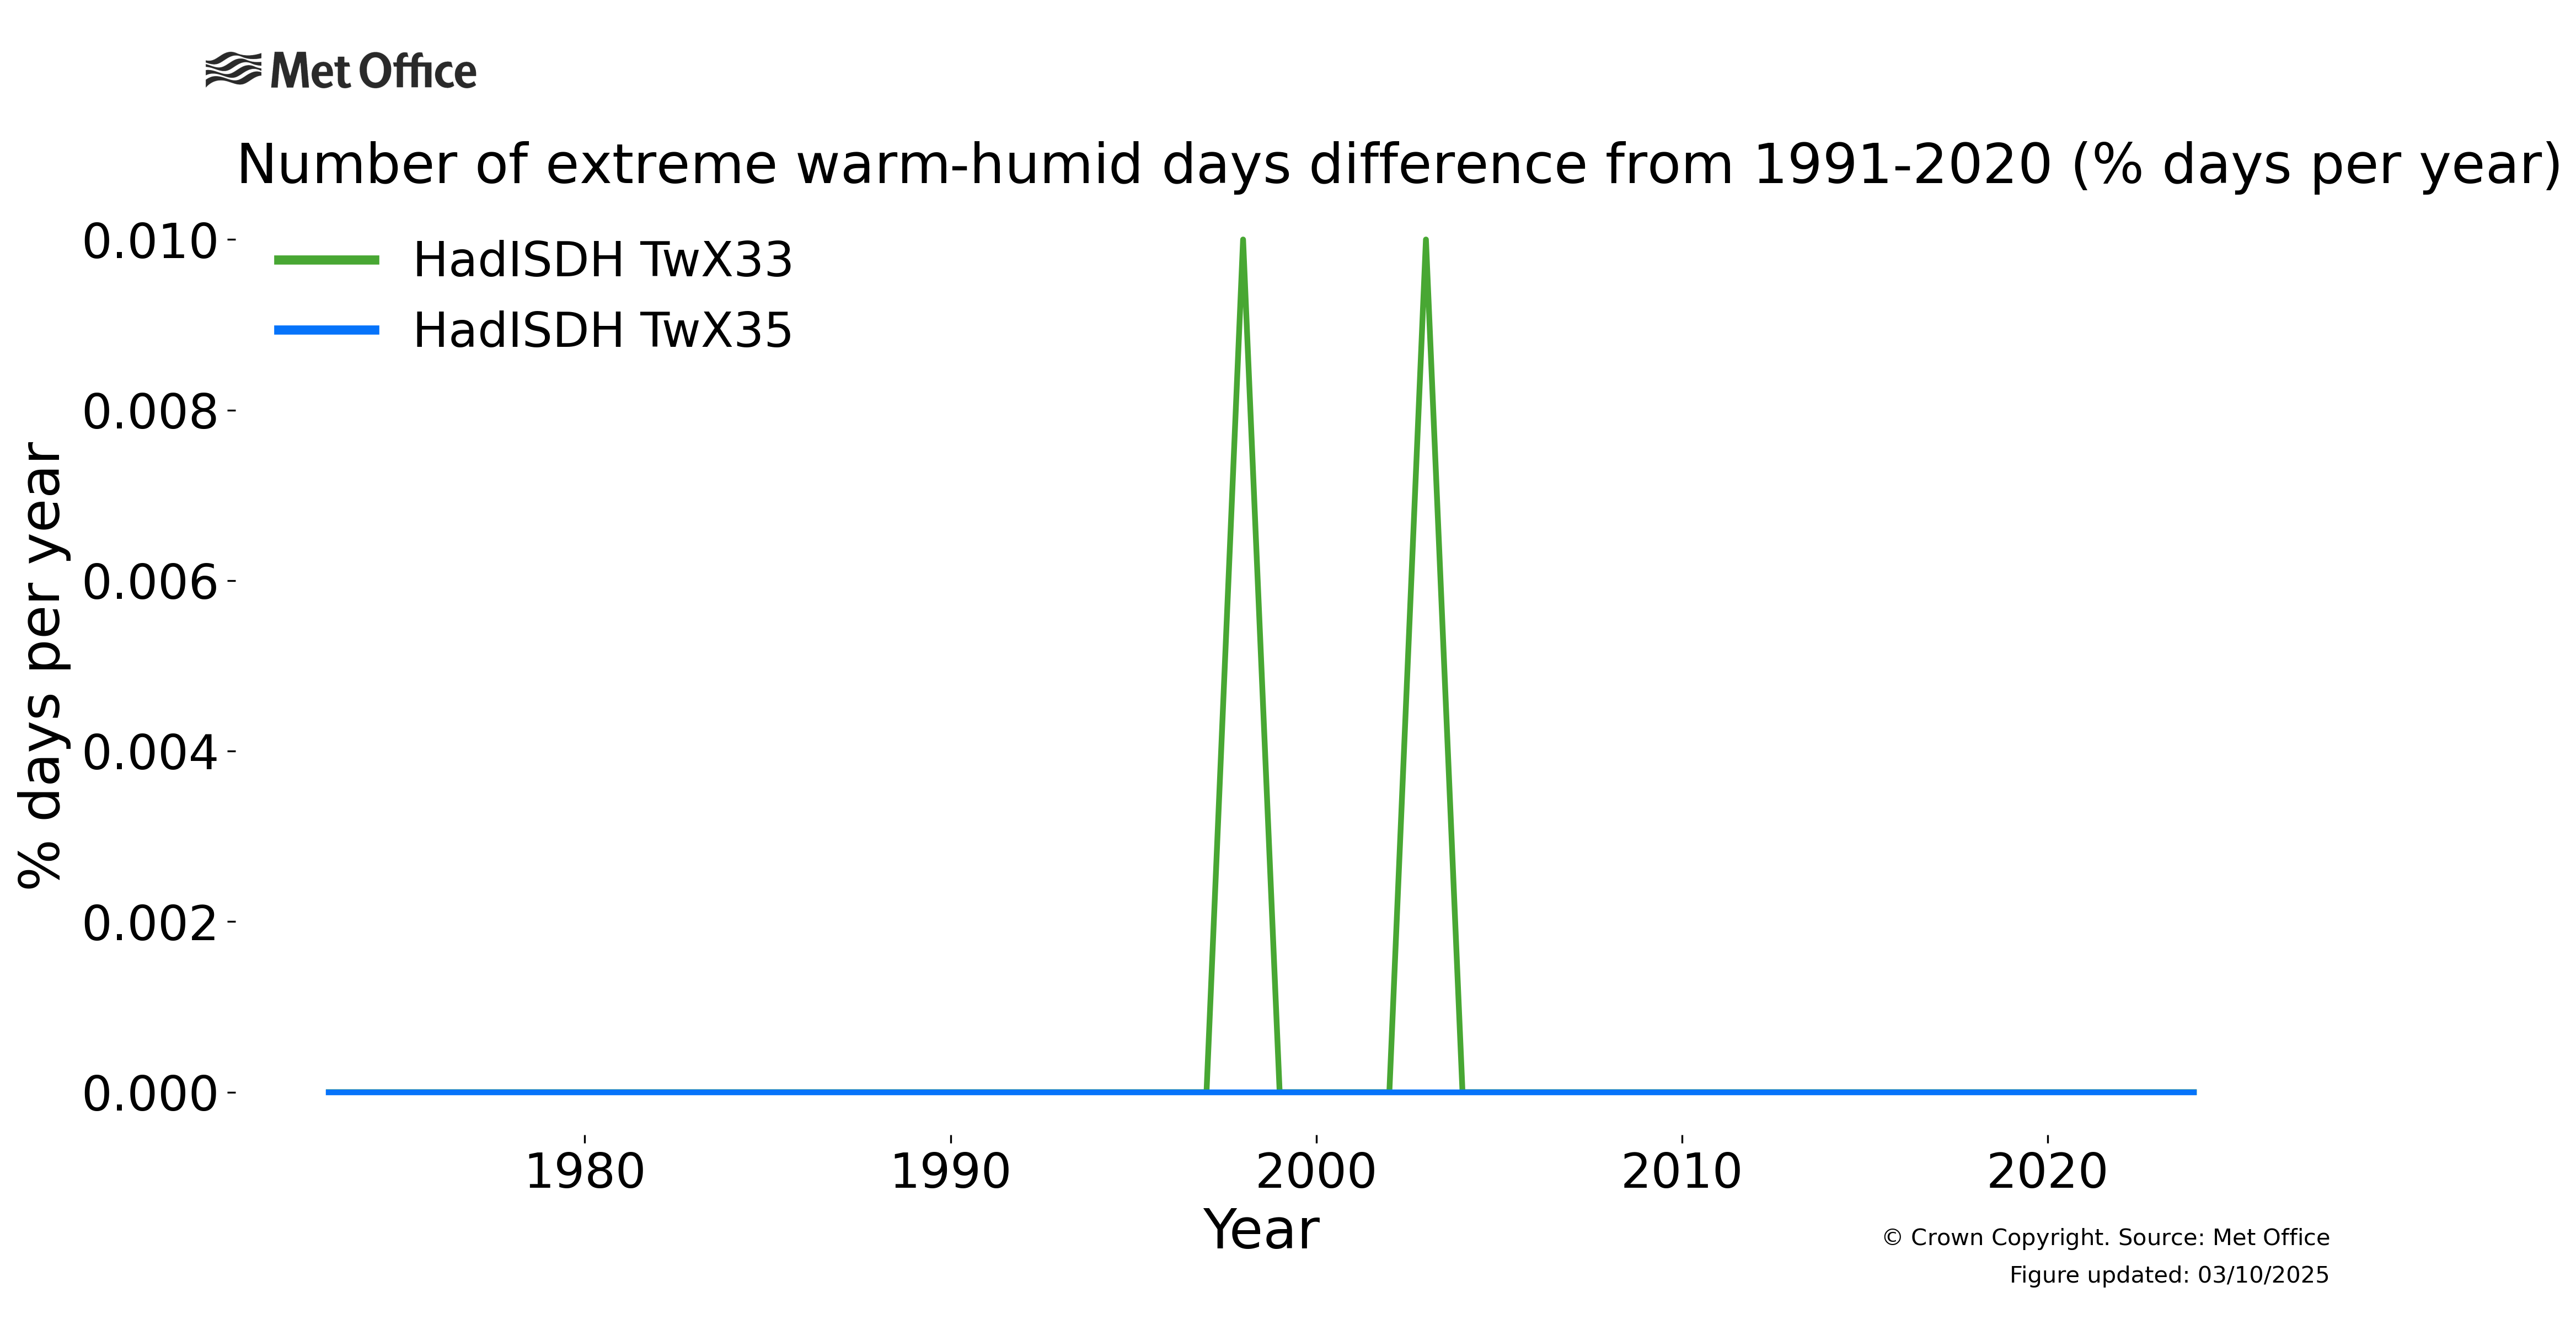
- Super extreme humid-heat days (TwX33 and TwX35) are defined as the number of days per month where the daily maximum wet-bulb temperature is equal to or exceeds 33 °C or 35 °C.
Why have humid-heat extremes changed?
The Intergovernmental Panel on Climate Change (IPCC) concluded in 2021 that “Human-induced greenhouse gas forcing is the main driver of the observed changes in hot and cold extremes on the global scale (virtually certain) and on most continents (very likely).” Additionally, it found that “Human-caused climate change has driven detectable changes in the global water cycle since the mid-20th century (high confidence).” and that “Global warming has contributed to an overall increase in atmospheric moisture”.
Several studies (e.g., Matthews et al., 2025, Powis et al., 2023) conclude that humid-heat events have become more intense with global climate change and will continue to do so. Regional events have also been attributed to climate change (e.g., World Weather Attribution, 2024: "Dangerous humid heat in southern West Africa about 4°C hotter due to climate change"). Hence, the expectation is that humid-heat will continue to increase in intensity and frequency while greenhouse gas emissions continue to increase.
Find out more?
More information on climate indices can be found at climdex.org.
HadISDH.extremes was developed by the Met Office with funding from the UK–China Research & Innovation Partnership Fund through the Met Office Climate Science for Service Partnership (CSSP) China as part of the Newton Fund.
- Met Office HadOBS data portal – https://www.metoffice.gov.uk/hadobs/hadisdh/
- CEDA Archive – https://catalogue.ceda.ac.uk/uuid/251474c7b09449d8b9e7aeaf1461858f/
- Add link to trends
Number of super extreme warm-humid days
HadISDH TwX33
- Information source: Willett, K.M. HadISDH.extremes Part I: A Gridded Wet Bulb Temperature Extremes Index Product for Climate Monitoring. Adv. Atmos. Sci. 40, 1952–1967 (2023). https://doi.org/10.1007/s00376-023-2347-8
- Information source: Willett, K.M. HadISDH.extremes Part II: Exploring Humid Heat Extremes Using Wet Bulb Temperature Indices. Adv. Atmos. Sci. 40, 1968–1985 (2023). https://doi.org/10.1007/s00376-023-2348-7
- Information reference: Willett, K.M. (2024): HadISDH.extremes: gridded global monthly land surface wet bulb and dry bulb temperature extremes index data version 1.1.0.2023f. NERC EDS Centre for Environmental Data Analysis, 12 July 2024. doi:10.5285/0a36ca390a5844578905780ed4c78ded. https://dx.doi.org/10.5285/0a36ca390a5844578905780ed4c78ded
HadISDH TwX35
- Information source: Willett, K.M. HadISDH.extremes Part I: A Gridded Wet Bulb Temperature Extremes Index Product for Climate Monitoring. Adv. Atmos. Sci. 40, 1952–1967 (2023). https://doi.org/10.1007/s00376-023-2347-8
- Information source: Willett, K.M. HadISDH.extremes Part II: Exploring Humid Heat Extremes Using Wet Bulb Temperature Indices. Adv. Atmos. Sci. 40, 1968–1985 (2023). https://doi.org/10.1007/s00376-023-2348-7
- Information reference: Willett, K.M. (2024): HadISDH.extremes: gridded global monthly land surface wet bulb and dry bulb temperature extremes index data version 1.1.0.2023f. NERC EDS Centre for Environmental Data Analysis, 12 July 2024. doi:10.5285/0a36ca390a5844578905780ed4c78ded. https://dx.doi.org/10.5285/0a36ca390a5844578905780ed4c78ded


