Why are extreme temperatures important?
High temperatures are important for living creatures and organisms as well as for elements of our infrastructure such as railway tracks or power lines. During periods of high temperatures, animals and plants may suffer as they are not able to cool themselves down. As the biosphere is adapted to its surrounding environment, higher-than-average temperatures in e.g., polar regions, can have as damaging an effect as higher-than-average temperatures in tropical regions. From a human perspective, during periods of hot weather we can suffer heatstroke if we are unable to cool down and thermo-regulate. During these periods, artificial air cooling may be necessary.
Our infrastructure also suffers, as this has usually been built to work within a specific range of temperatures. For example, road surfaces can melt or buckle, railway tracks can buckle and electricity lines sag during high temperatures.
How have temperature extremes changed?
From the beginning of the 20th Century, the number of warm days rose until a small peak in the 1940s, followed by a slight decline to the 1970s. Since then, the number of warm days has risen globally, with around an additional 20 "warm" days per year in the most recent decade when compared to the 1970s.
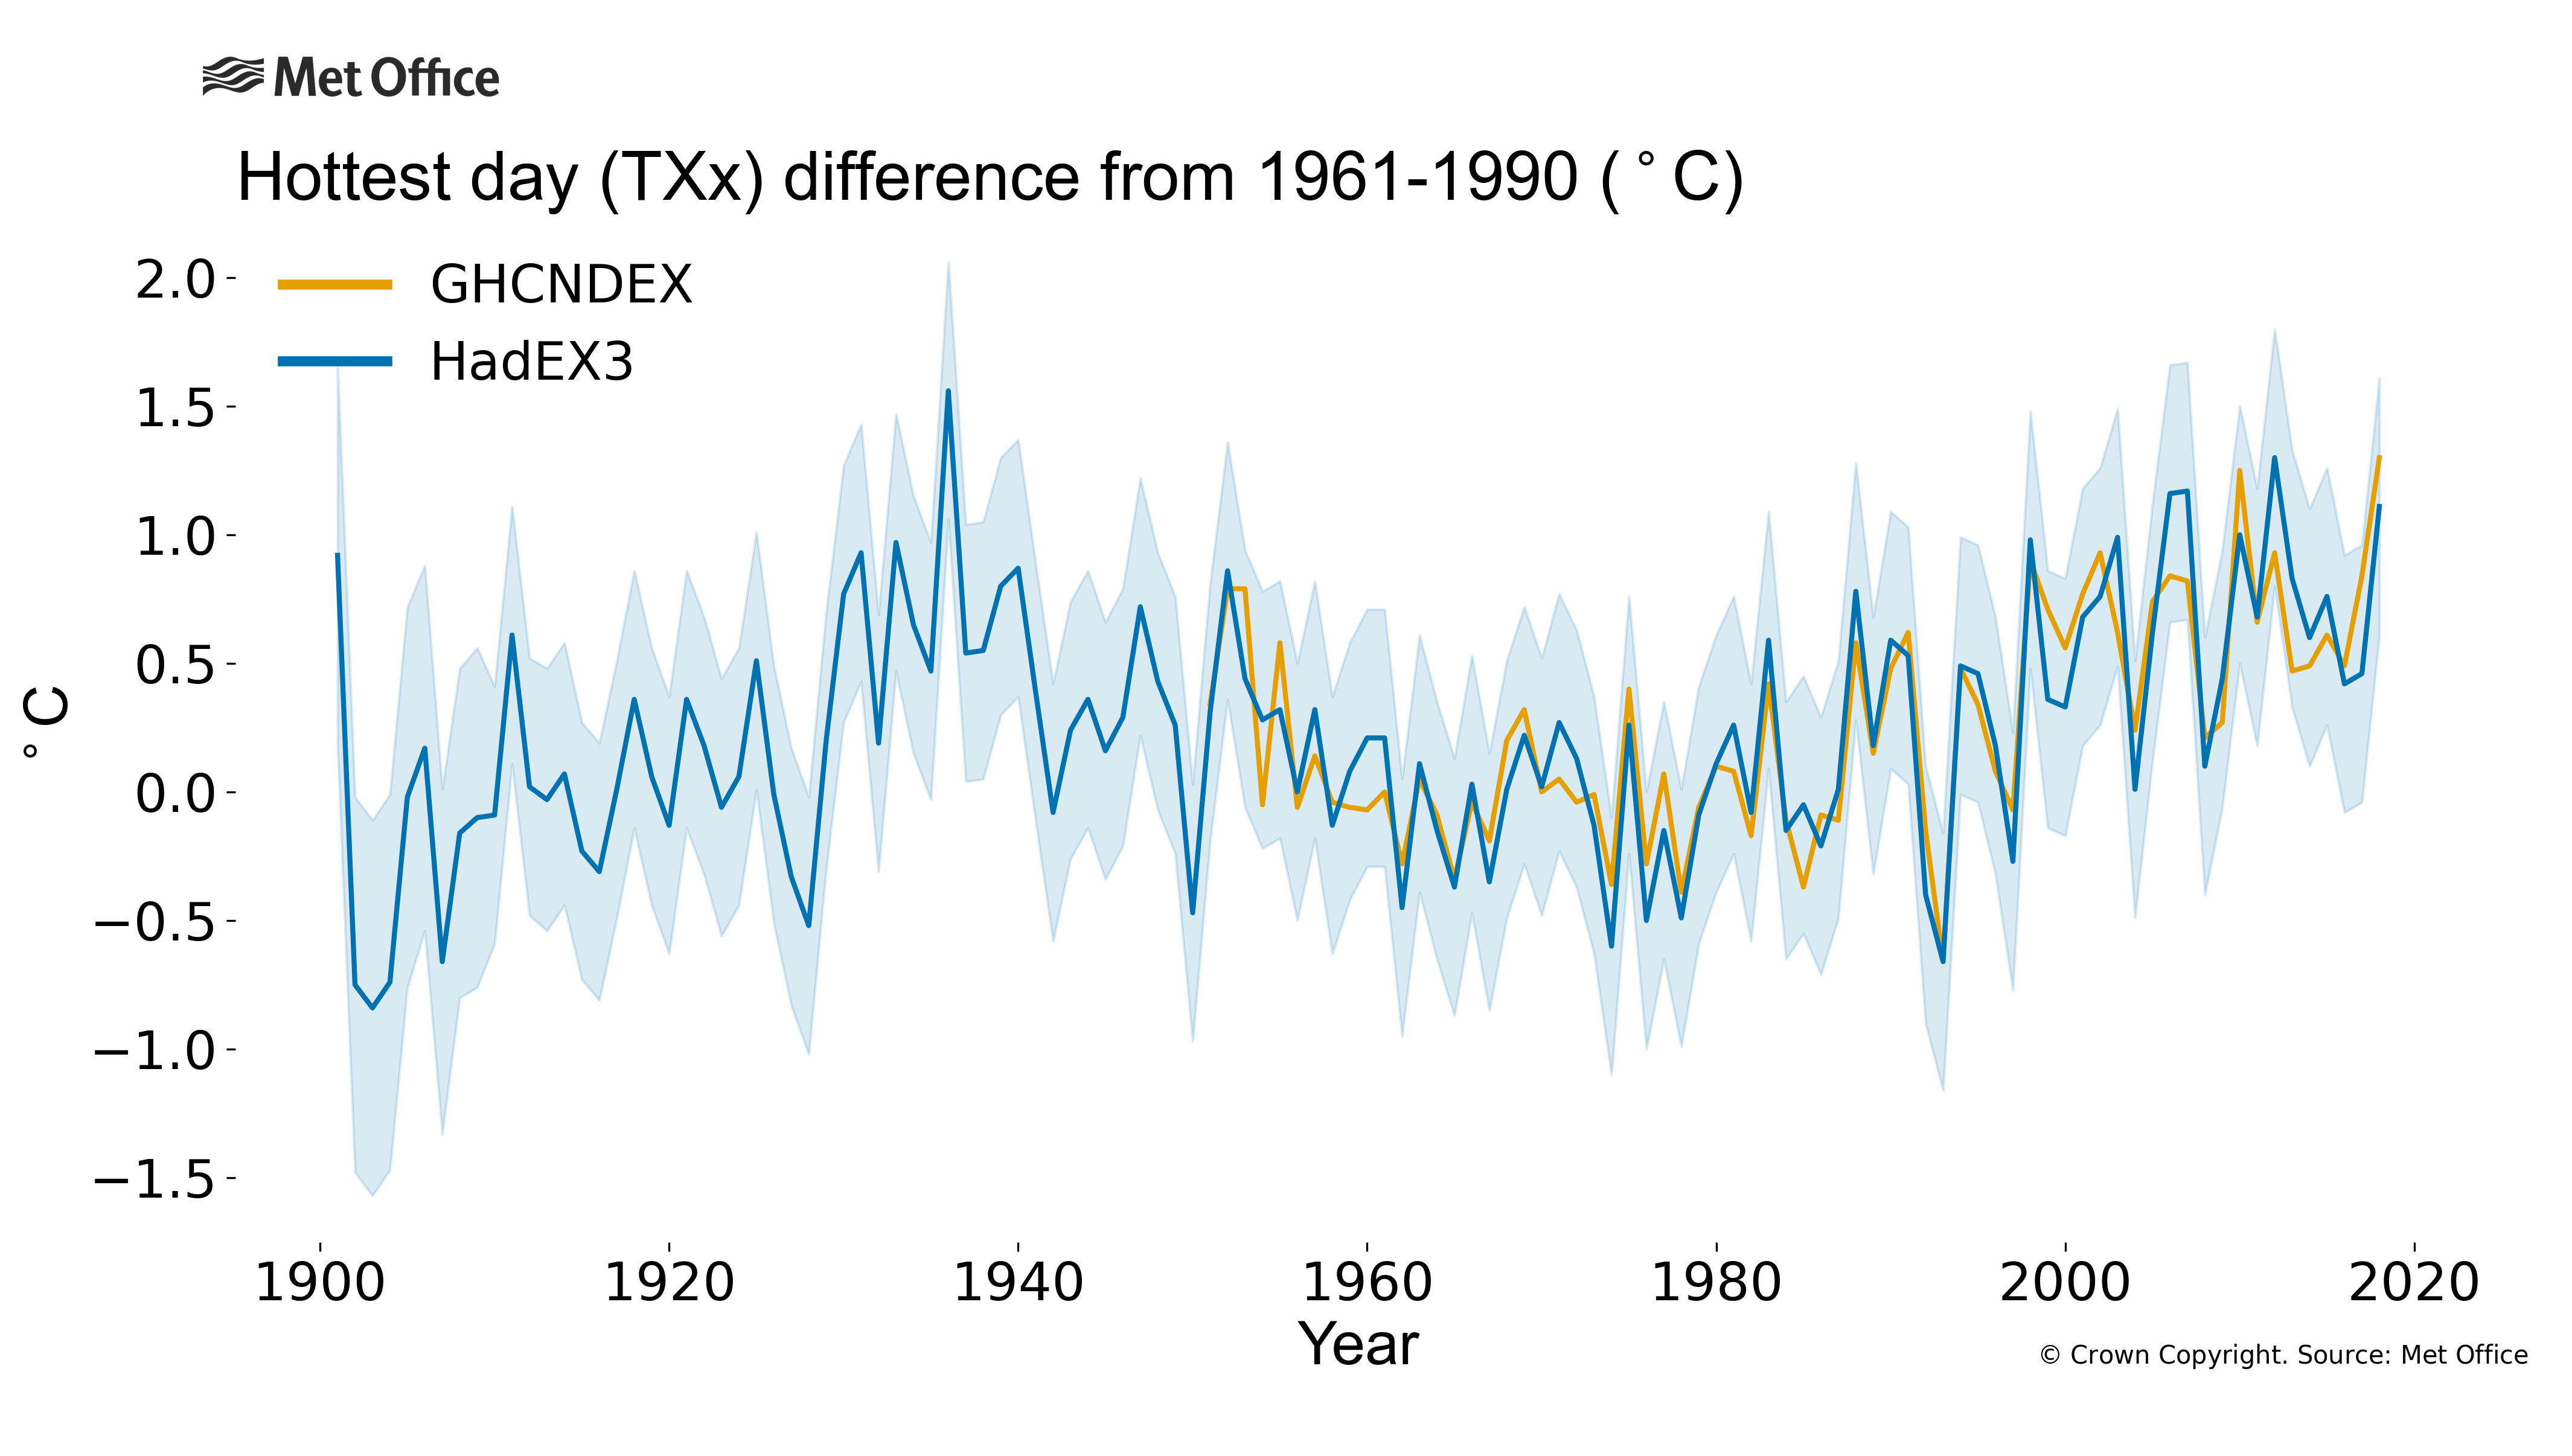
The temperatures of the hottest days (TXx) appear to have peaked in the 1930s. However, this index is more strongly affected by the spatial coverage than the warm days indicator (TX90p). During the early part of the record, we mainly have data over North America, Europe and parts of Australia, and the 1930s peak coincides with the Dust Bowl event in the USA. However, the overall shapes of all three curves show a rise in the early part of the 20th century, followed by a few decades of decline or little change and then, from around the 1970s, a strong rise.
In comparison with the indices measuring low temperatures (on the other end of the temperature distribution) the changes over time for all three indices show clearly the peak in the middle of last century, with an interruption to the overall increase during this period.
How are the temperature indices defined?
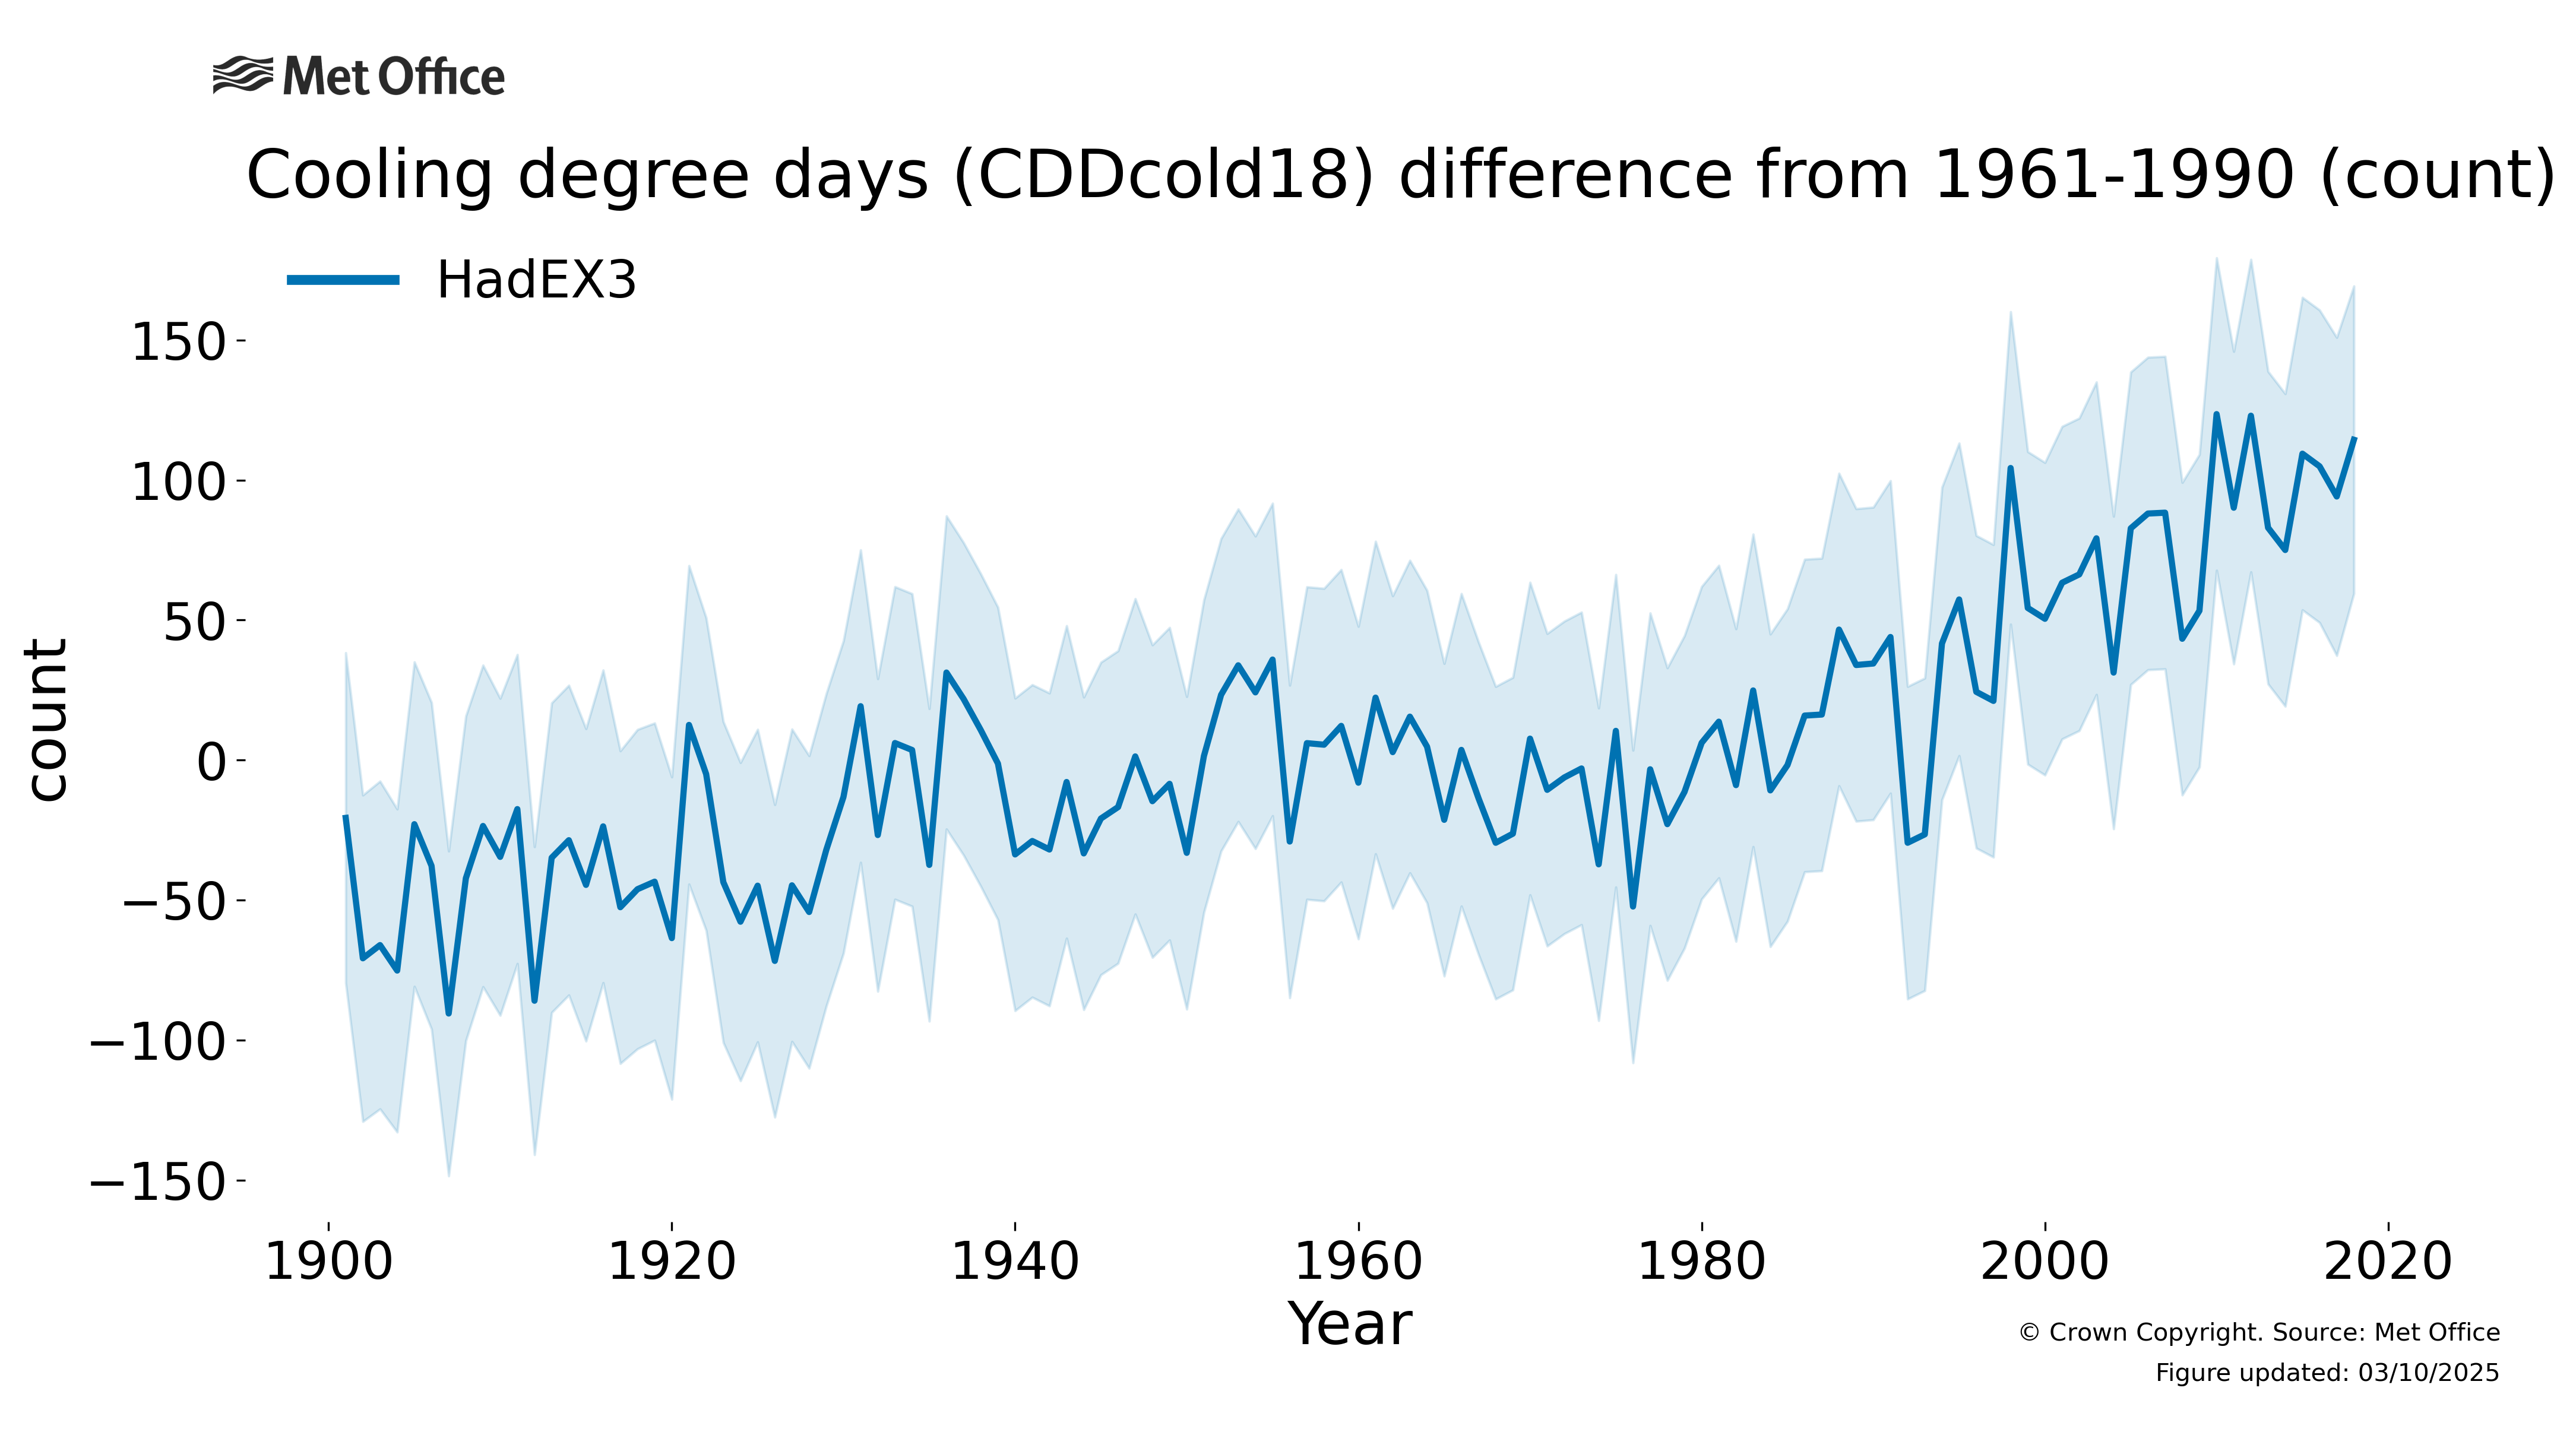
The “Warm Days” index (TX90p) measures the number of days where the maximum temperature (Tx) exceeds a threshold set by the 90th percentile value (that level which the hottest 10% of days exceed). This threshold is set using a reference period (1961-90). The “Hottest Day” (TXx) is the simplest, the warmest maximum temperature reached within a year. Finally, the cooling degree days index (CDDcold18) cumulatively sums up the difference between the average temperature (TM) and 18°C for each day in a year, as a measure of the energy demand needed to cool a building.
Why have extreme temperatures changed?
The Intergovernmental Panel on Climate Change (IPCC) concluded in 2013 that “It is very likely that anthropogenic forcing has contributed to the observed changes in the frequency and intensity of daily temperature extremes on the global scale since the mid-20th century.” They also said that “it is likely that human influence has substantially increased the probability of occurrence of heatwaves in some locations.”
The indices presented on this page measure the frequency (TX90p) and intensity (TXx) of heatwaves, and so changes in these are very likely to have come from the emission of greenhouse gases and other human activities with impacts on our climate.
Find out more?
More information on climate indices can be found at climdex.org.
HadEX3 was developed in collaboration between the Met Office, ARC Centre of Excellence for Climate Extremes at the University of New South Wales, Environment and Climate Change Canada and Barcelona Supercomputing Center. For a full list of contributors, please see the journal article and the main dataset webpage for HadEX3.
- HadEX3 – www.metoffice.gov.uk/hadobs/hadex3/ , www.climdex.org – https://doi.org/10.1029/2019JD032263 and https://hadex-extremes.blogspot.com/
- GHCNDEX – www.climdex.org, https://doi.org/10.1175/BAMS-D-12-00109.1


