Why are extreme temperatures important?
For regions with a strong seasonal cycle, the onset of winter and the associated cold temperatures are an important marker during the year. Some plants need frosts to help with germination; although terminal for some individuals, cold temperatures help reduce the population of parasites and “pest” animals.
During the summer, high minimum temperatures can contribute to heat stress during heatwaves as the body has no opportunity to cool off between the peaks of temperature each day.
In mountainous or polar regions, winters are important as this is the period when snow falls, and ice and ground freezes. If minimum temperatures are warmer, then this results in more precipitation falling as rain rather than snow, more snow melting (both affecting how glaciers are fed), and a shorter period of freezing for ice and permafrost. These can affect the plants and animals who live in these regions, but also those societies who rely on winter snow and ice for their livelihoods. Also, structures which are built on frozen ground can become unstable should the permafrost thaw, and in alpine regions, mountainsides can become unstable as the binding ice melts, threatening dwellings in the valleys below.
How have temperature extremes changed?
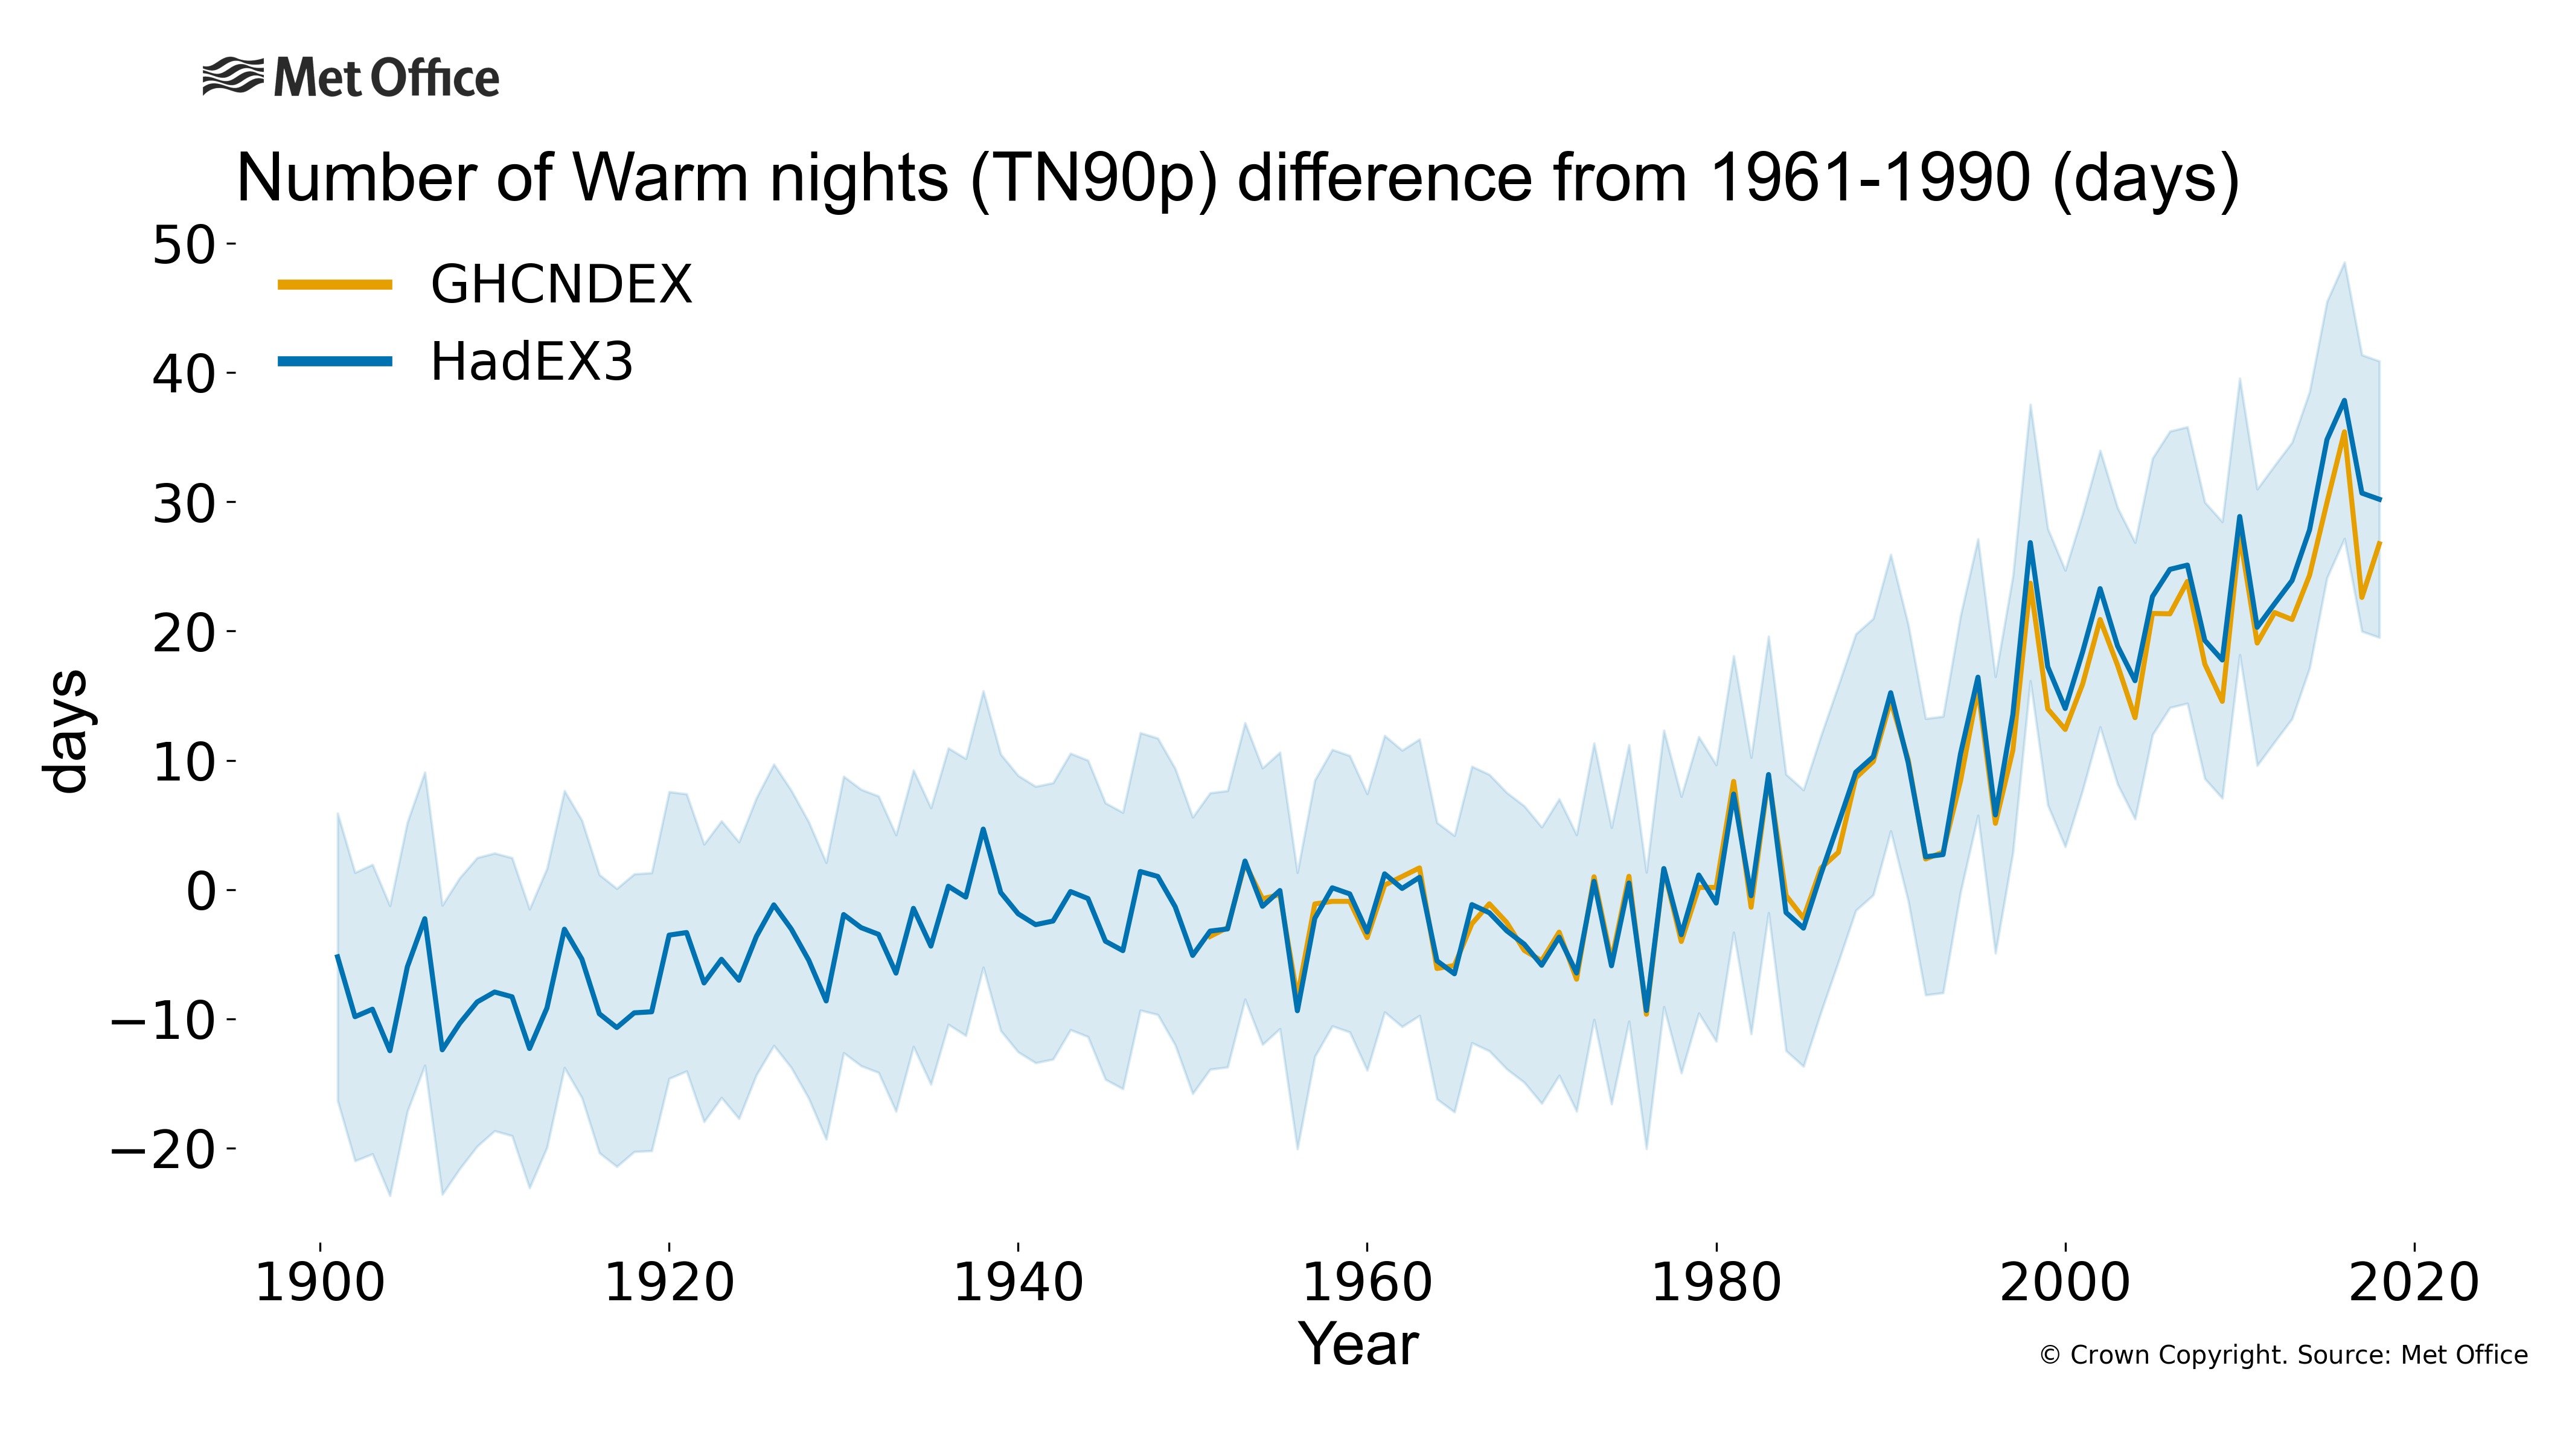
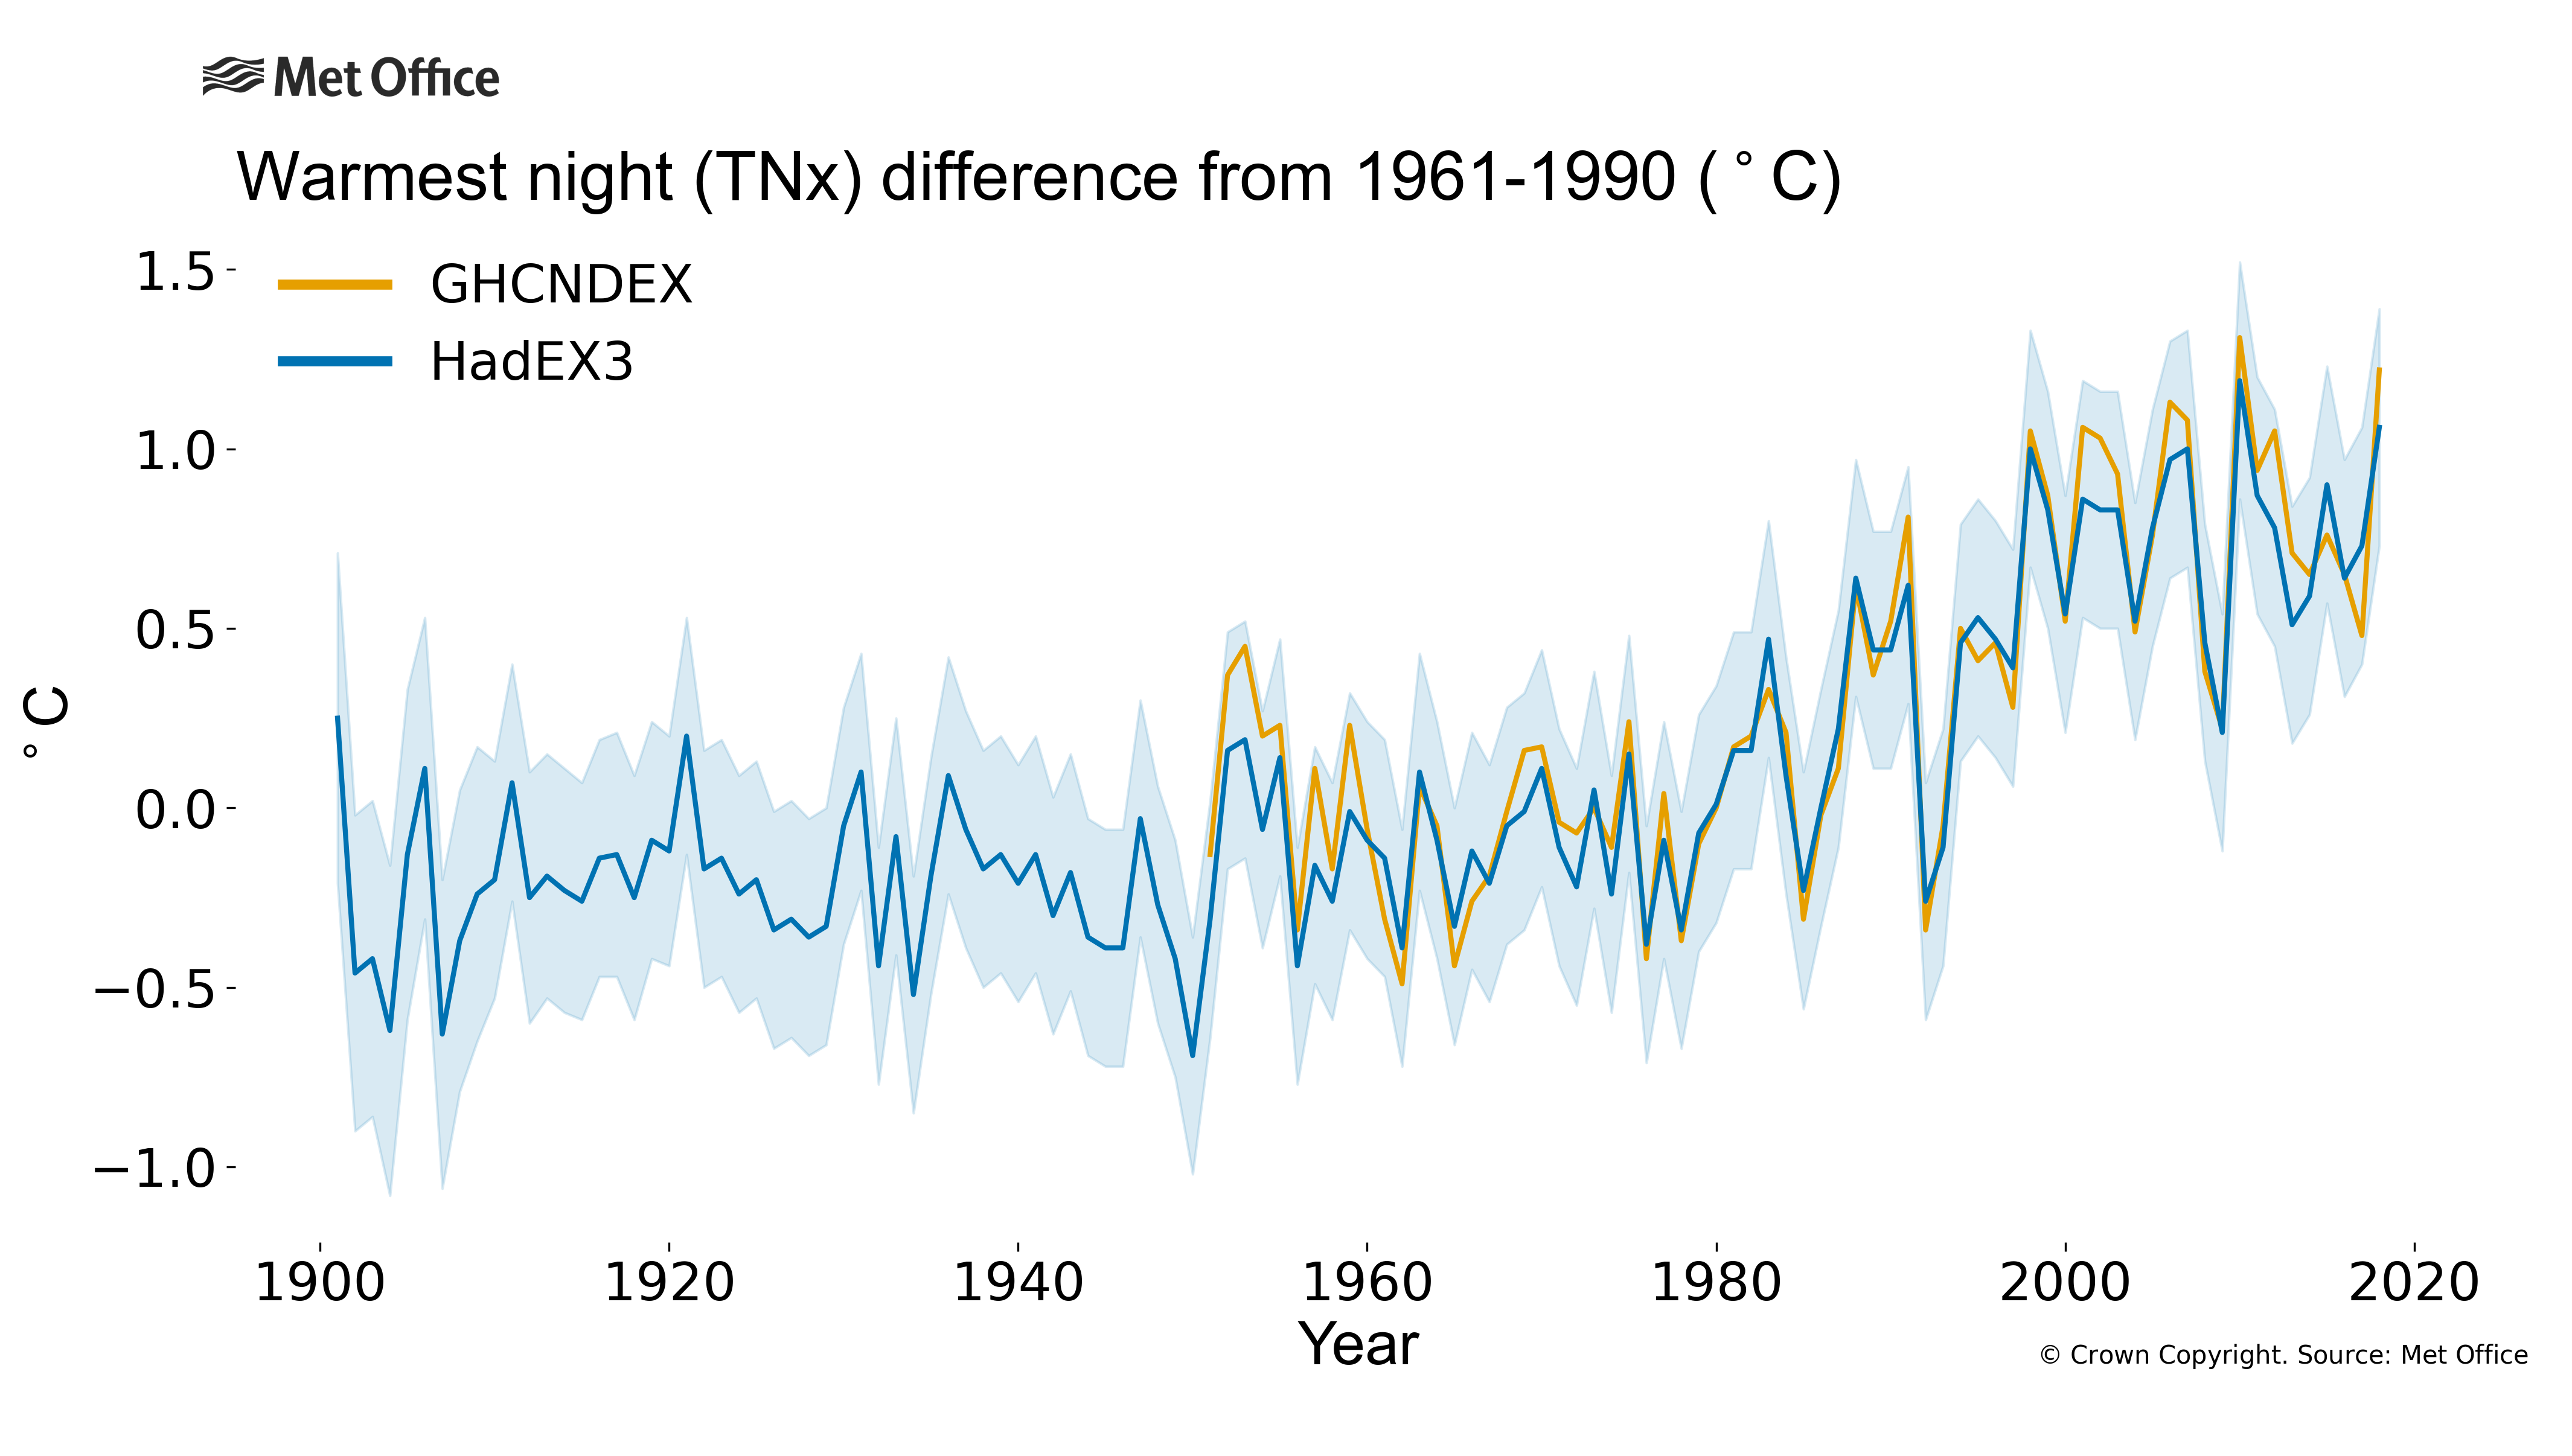
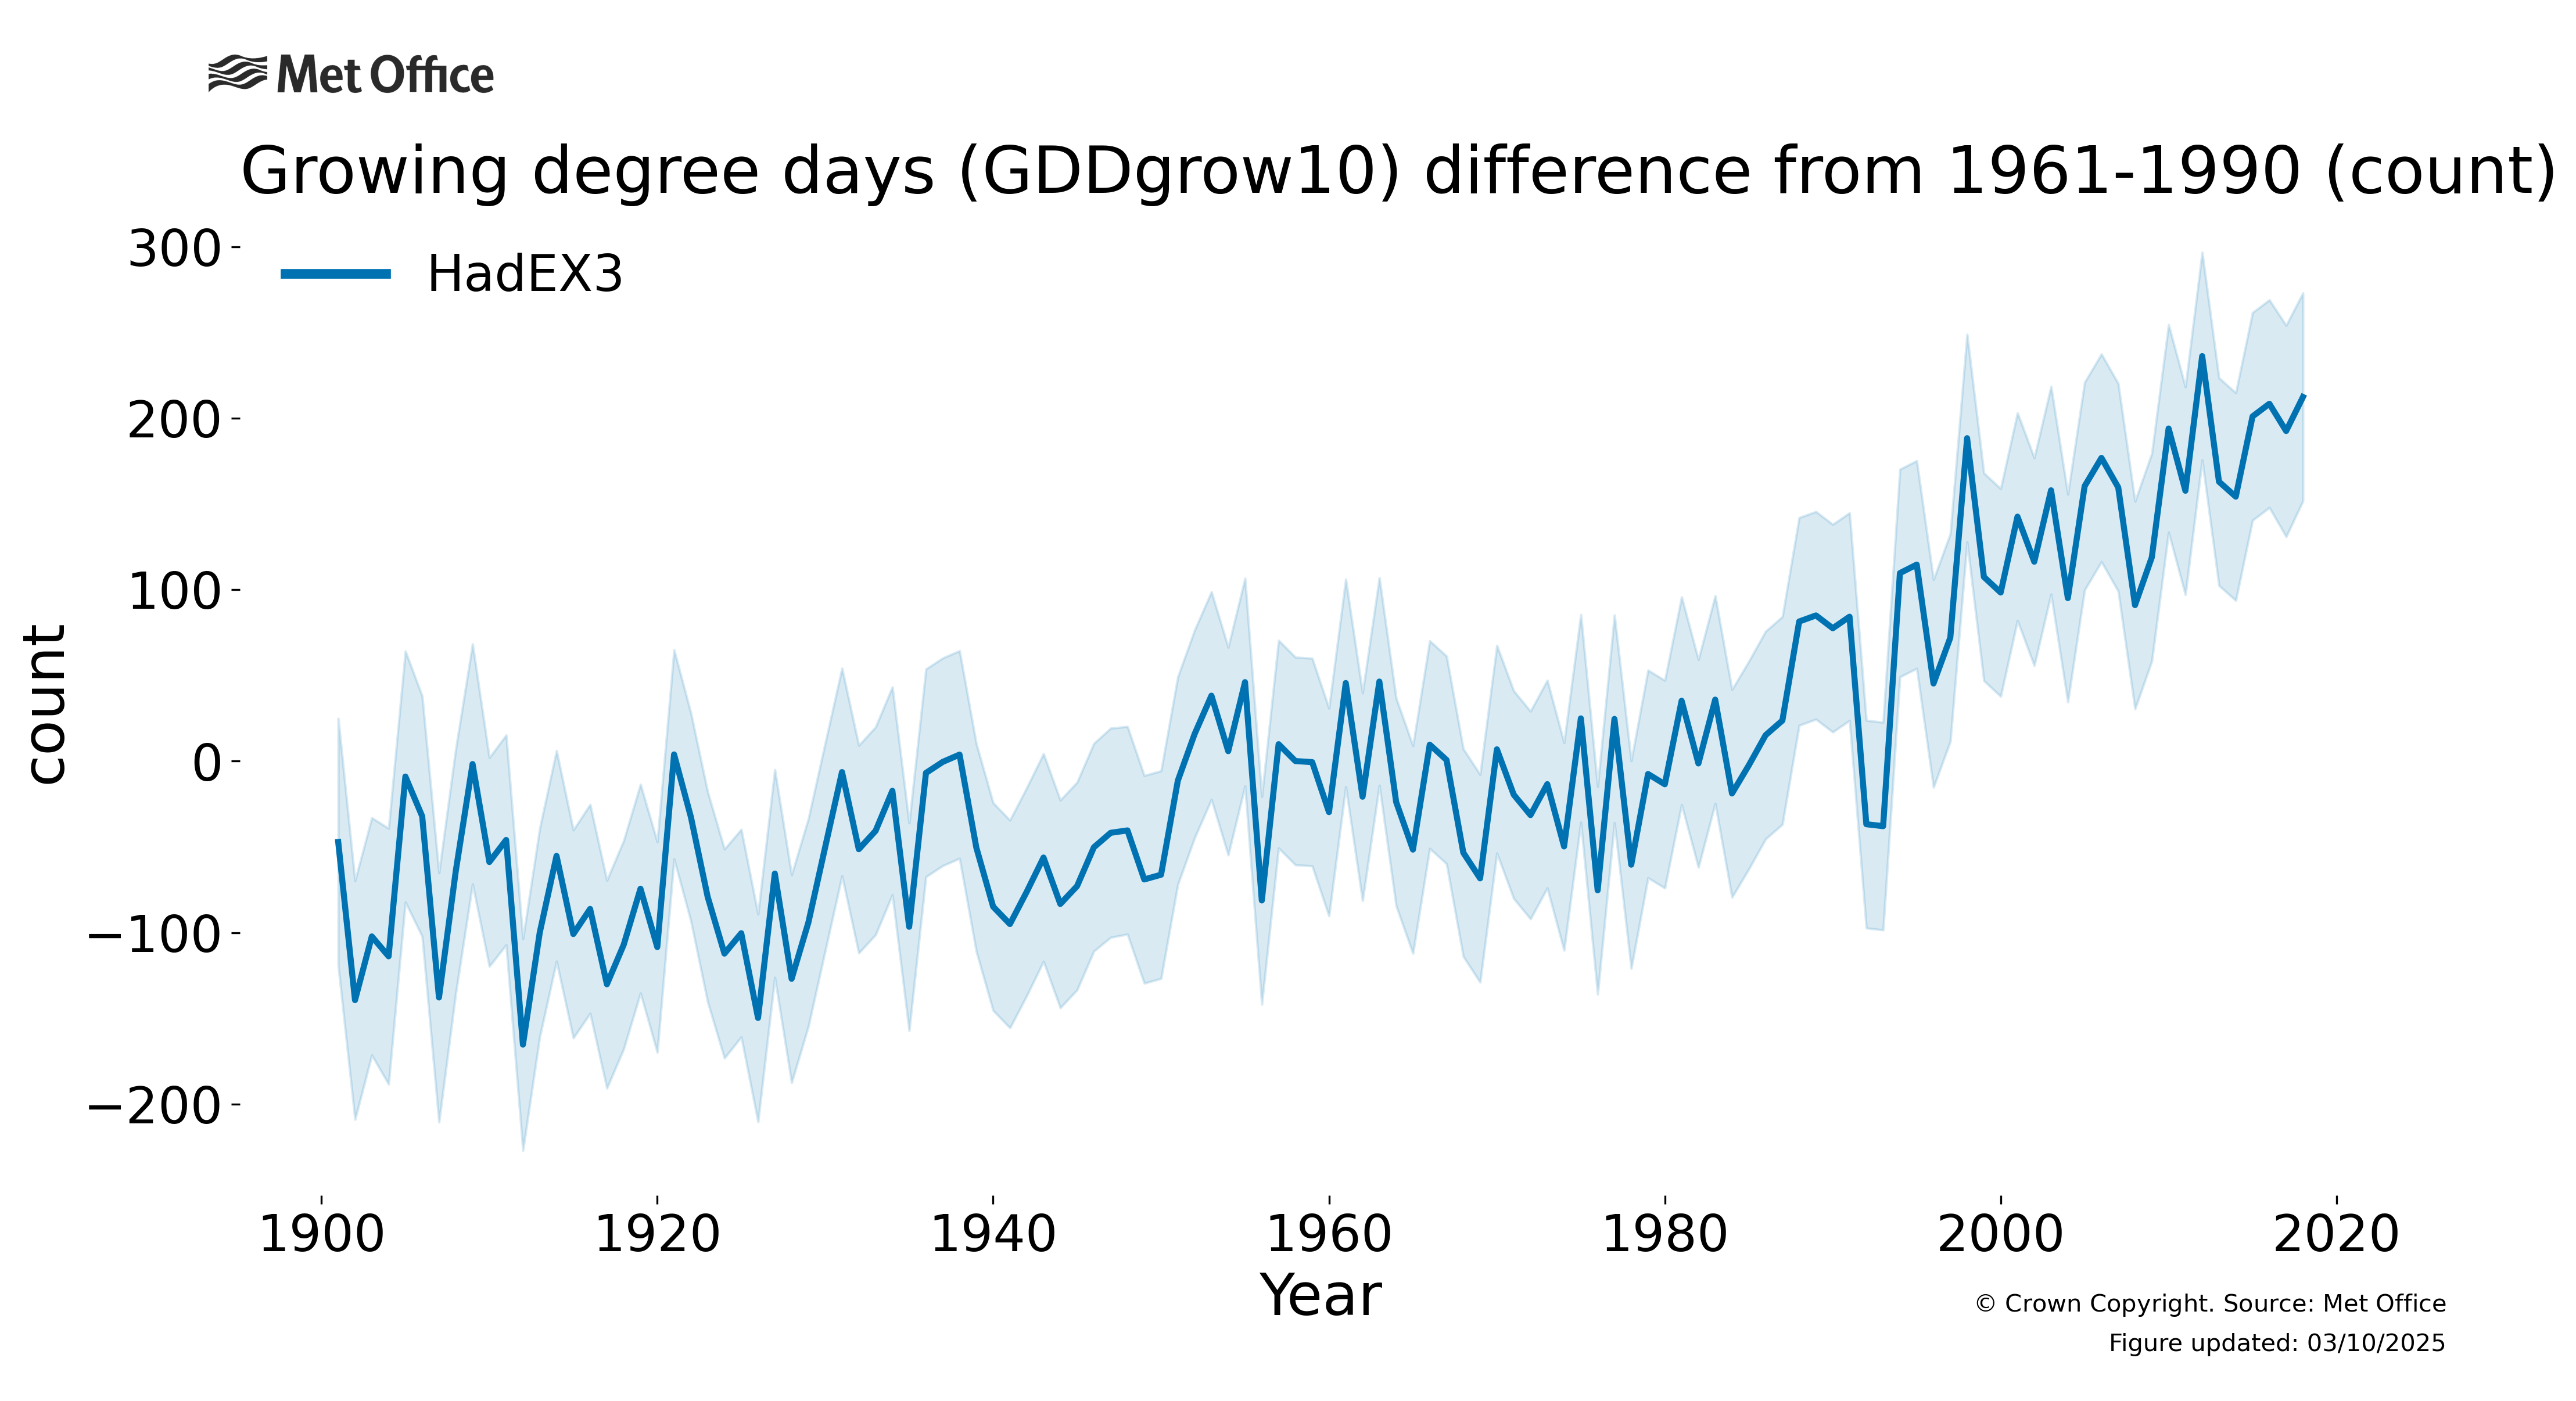
The number of warm nights has increased since the beginning of the 20th Century, with around 30 more warm nights since the middle of the century. Correspondingly the number of growing degree days has also increasd by over 200 degree-days on average (globally) during the same period. And the temperature of the warmest nights has on average increased by around 1°C.
How are the temperature indices defined?
The “Warm Nights” index (TN90p) measures the number of days where the minimum temperature (Tn) exceeds a threshold set by the 90th percentile value (that level which the warmest 10% of nights exceed). This threshold is set using a reference period (1961-90). The “Growing Degree Days” (GDDgrow10) cumulatively sums the difference between the average temperature (TM) and 10°C, as a measure of accumulated warmth to stimulate plant growth. And, finally, the “Warmest Night” (TNx) is the simplest: the highest minimum temperature reached within a year.
Why have extreme temperatures changed?
The Intergovernmental Panel on Climate Change (IPCC) concluded in 2013 that “It is very likely that anthropogenic forcing has contributed to the observed changes in the frequency and intensity of daily temperature extremes on the global scale since the mid-20th century.”
The indices presented on this page measure the frequency (TN90p) and intensity (TNx) of warm spells, and so changes in these are very likely to have come from the emission of greenhouse gases and other human activities with impacts on our climate. At the time of the last IPCC assessment, no such conclusion could be drawn about the duration of growing degree days (GDDgrow10).
Find out more?
More information on climate indices can be found at climdex.org.
HadEX3 was developed in collaboration between the Met Office, ARC Centre of Excellence for Climate Extremes at the University of New South Wales, Environment and Climate Change Canada and Barcelona Supercomputing Center. For a full list of contributors, please see the journal article and the main dataset webpage for HadEX3.
- HadEX3 – www.metoffice.gov.uk/hadobs/hadex3/ , www.climdex.org – https://doi.org/10.1029/2019JD032263 and https://hadex-extremes.blogspot.com/
- GHCNDEX – www.climdex.org, https://doi.org/10.1175/BAMS-D-12-00109.1


