Why are extreme temperatures important?
Heatwaves and “cold waves” are important as sometimes even if individual days are not that much warmer or cooler than average, a consecutive run of them will trigger heat health or cool weather health impacts. These duration indices provide an alternative measure of heat and cold waves, which can be characterised by their duration as well as their intensity. For duration measures sometimes the total number of warm days (ignoring gaps) is useful, whereas at other times, contiguous periods are a useful measurement.
The growing season assesses when (on average) plants are able to put on growth and is of more relevance in regions like the mid-latitudes which have a strong seasonal cycle. Longer growing seasons can be beneficial to farmers and growers. However, farmers taking advantage of a longer growing season can experience significant impacts associated with late spring or early autumn frosts.
How have temperature extremes changed?
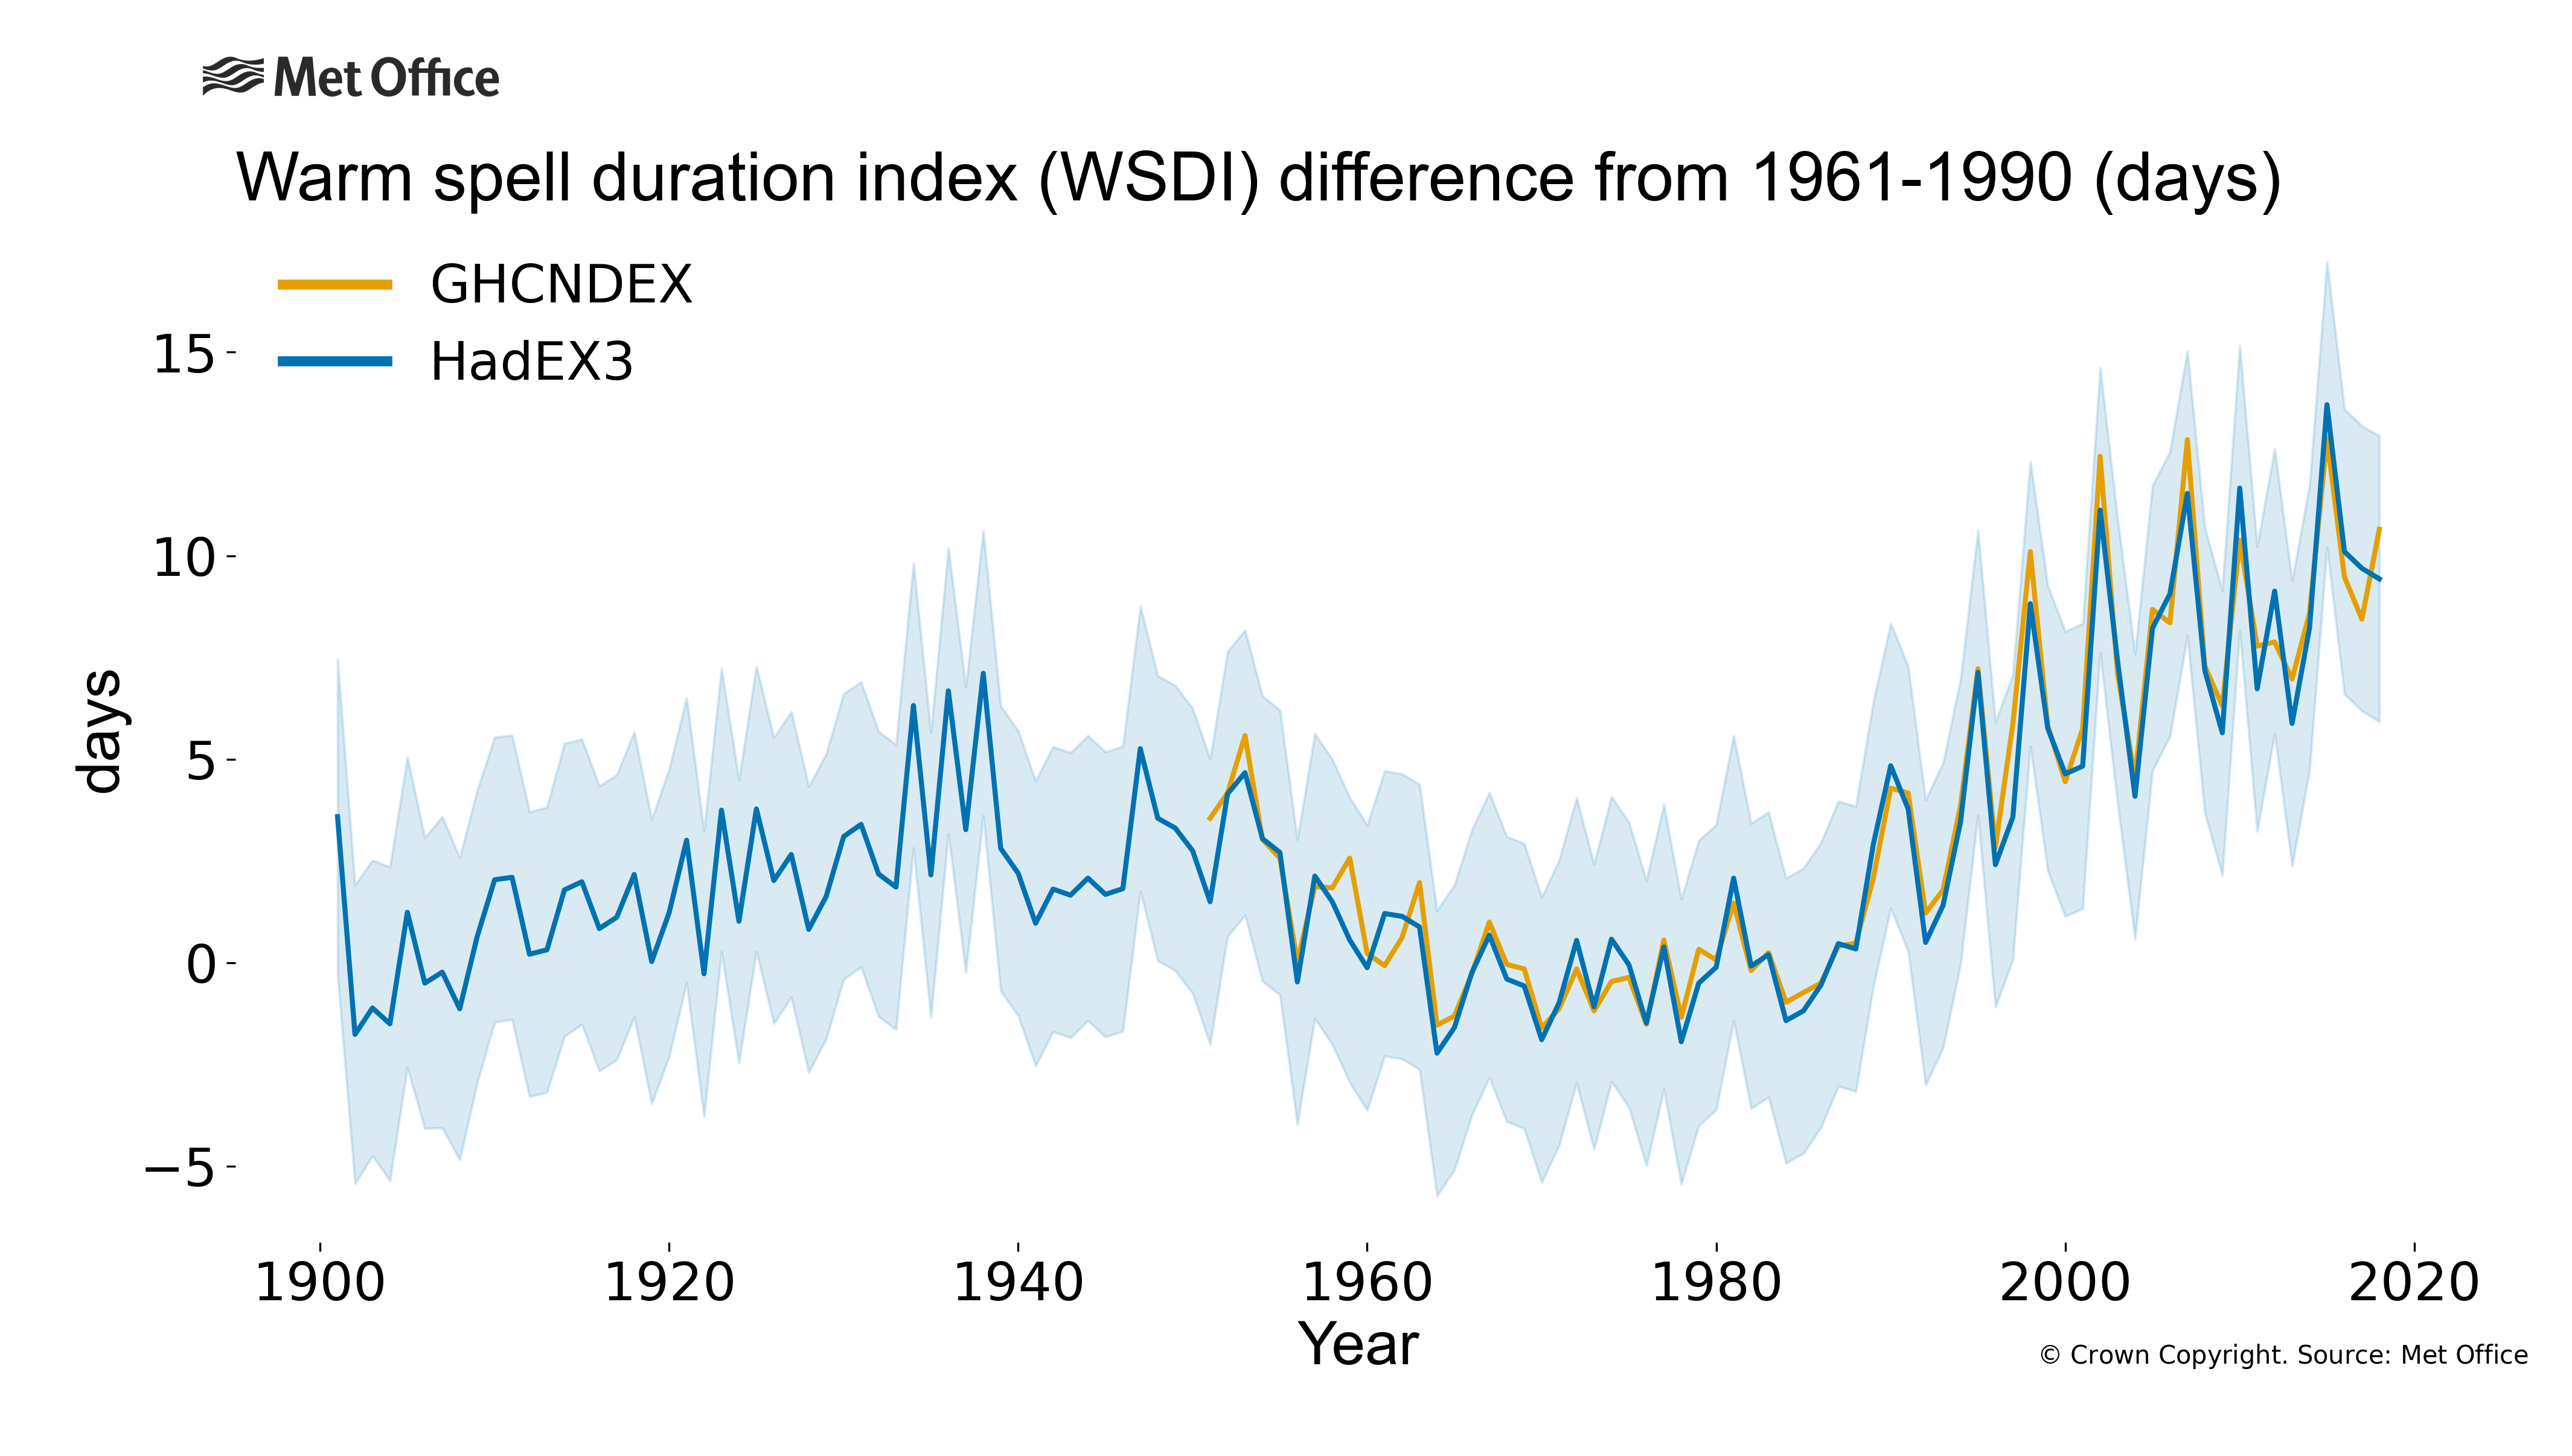
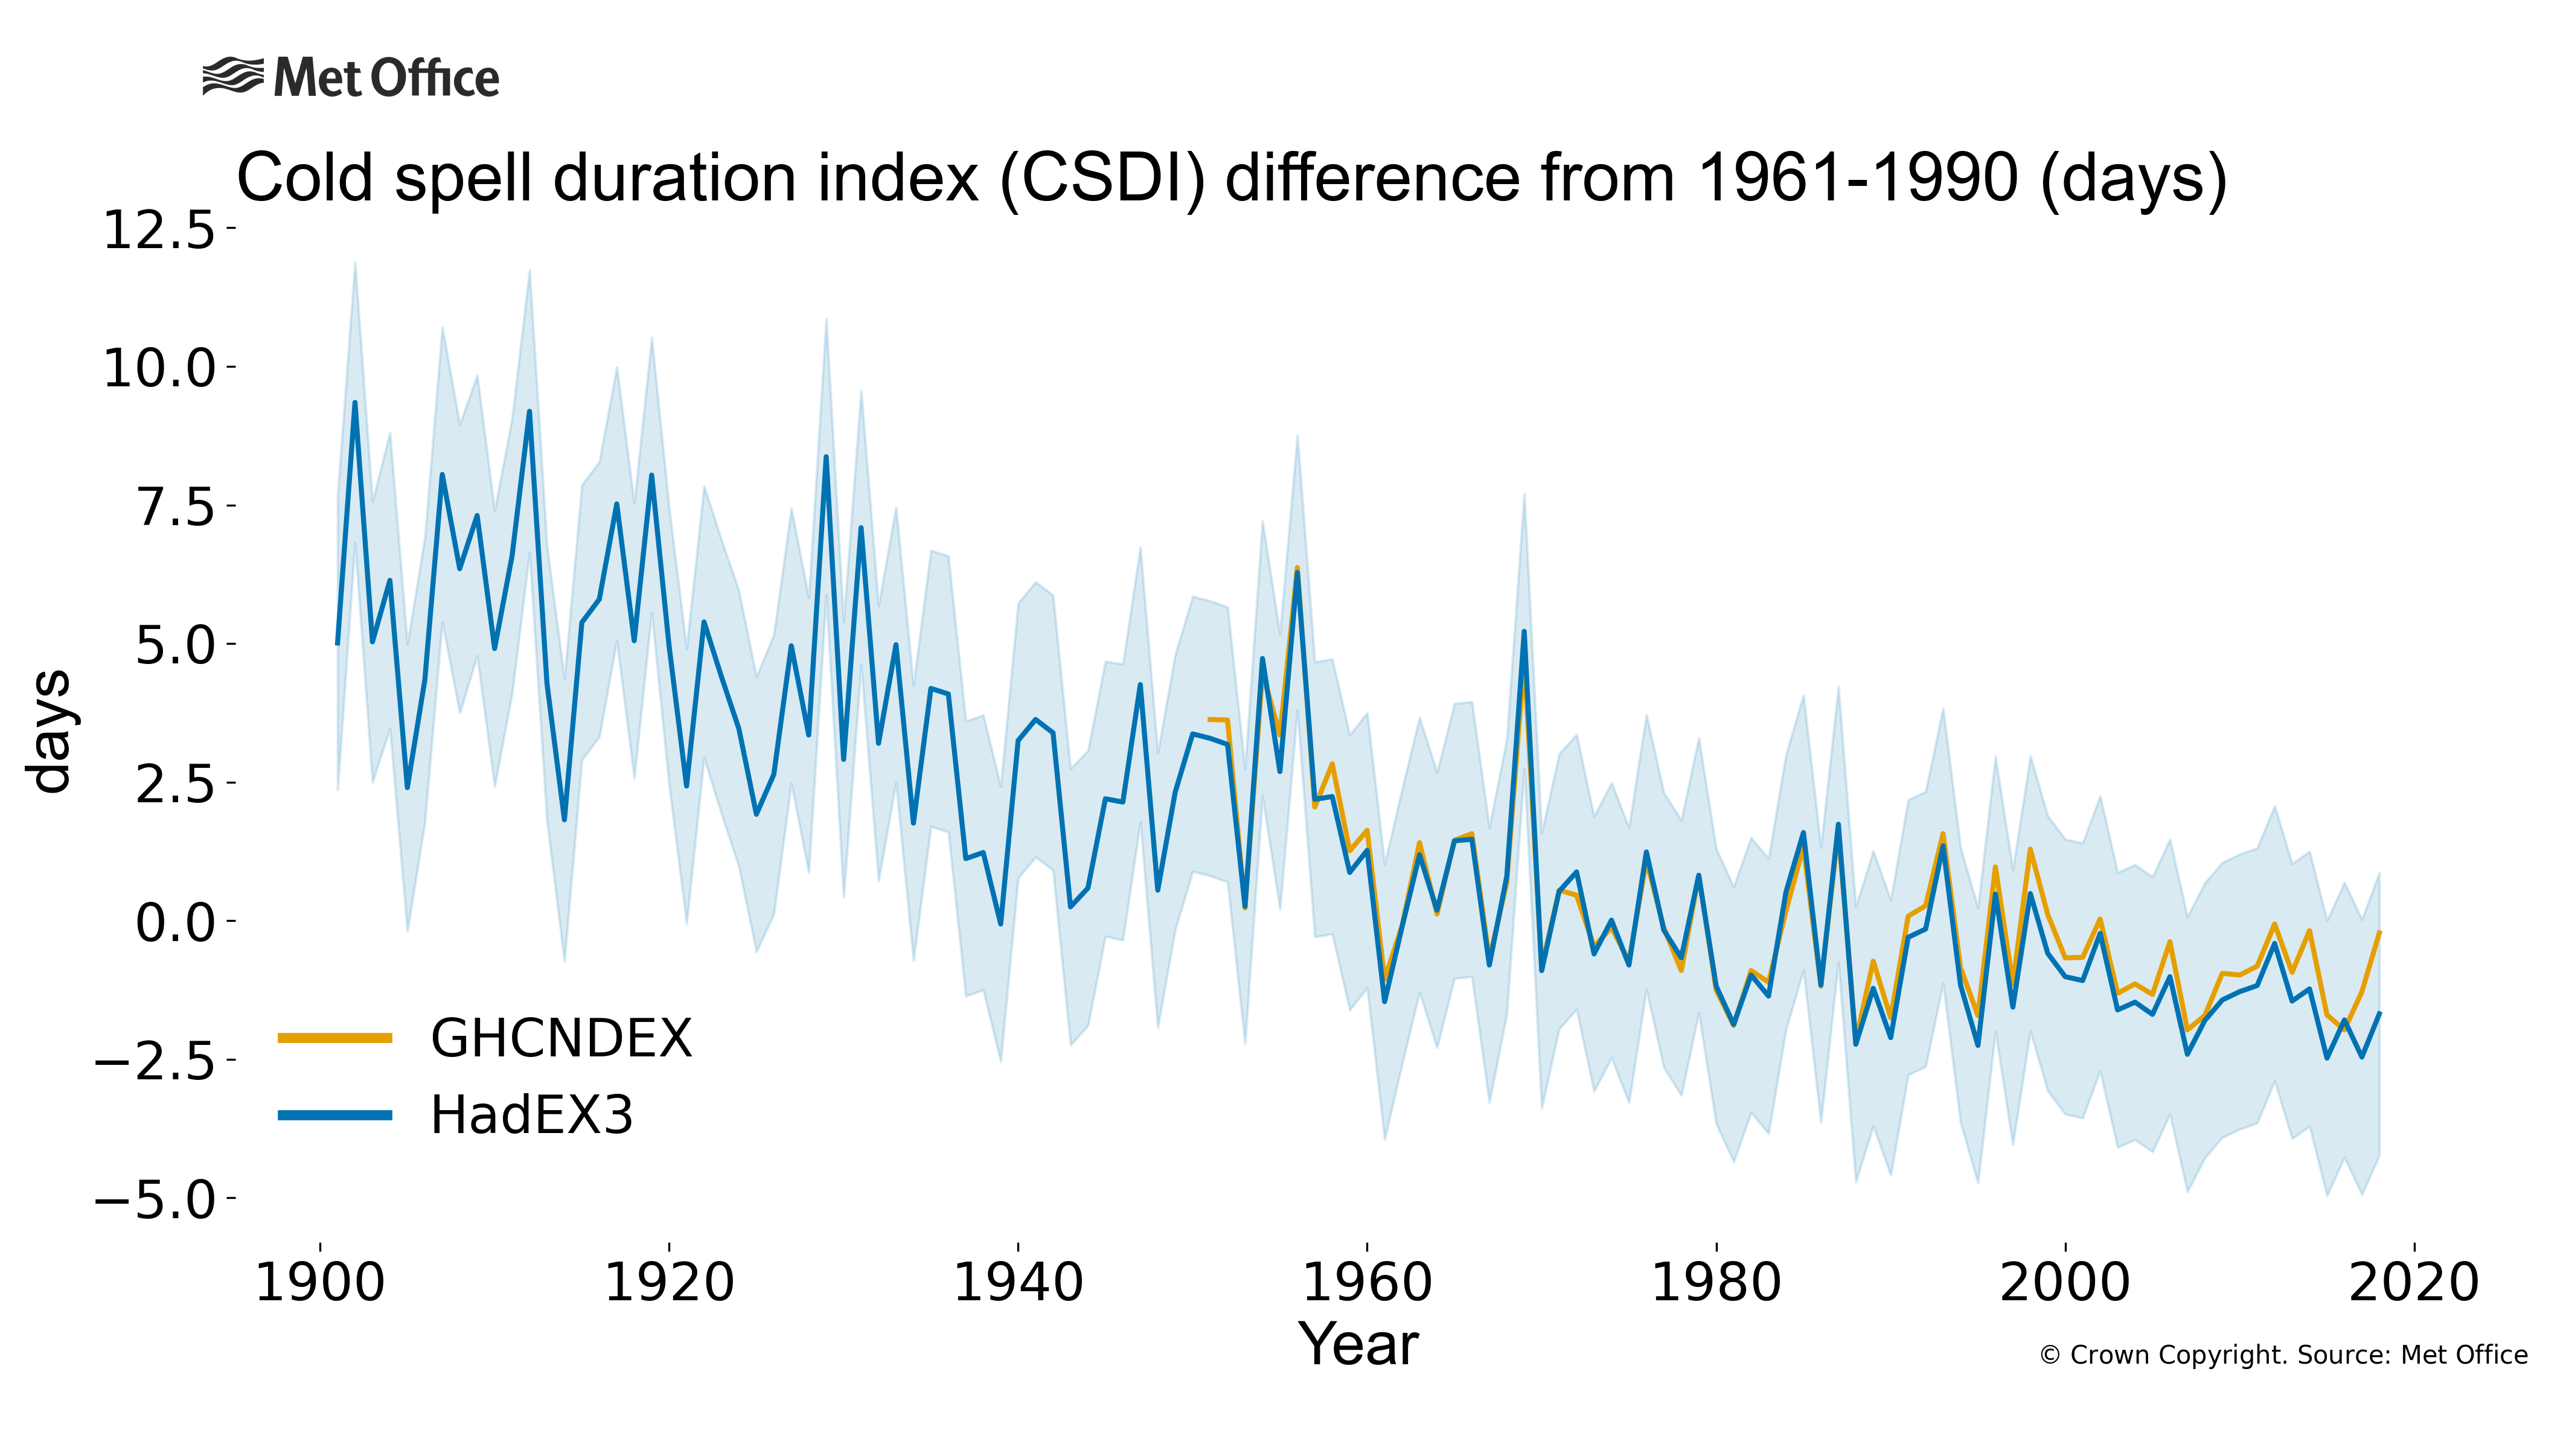
The length of warm spells has increased since the 1970s, in line with changes in other warm temperature extremes. Conversely, the length of cool spells has decreased, but in this case since the beginning of the 20th century. The minor peak in the warm spell index in the 1930s is linked to the Dust Bowl of the American mid-west. This multi-year event stands out comparatively prominently because the spatial coverage of the dataset during this period is predominantly limited to North America, Europe and some parts of Australia.
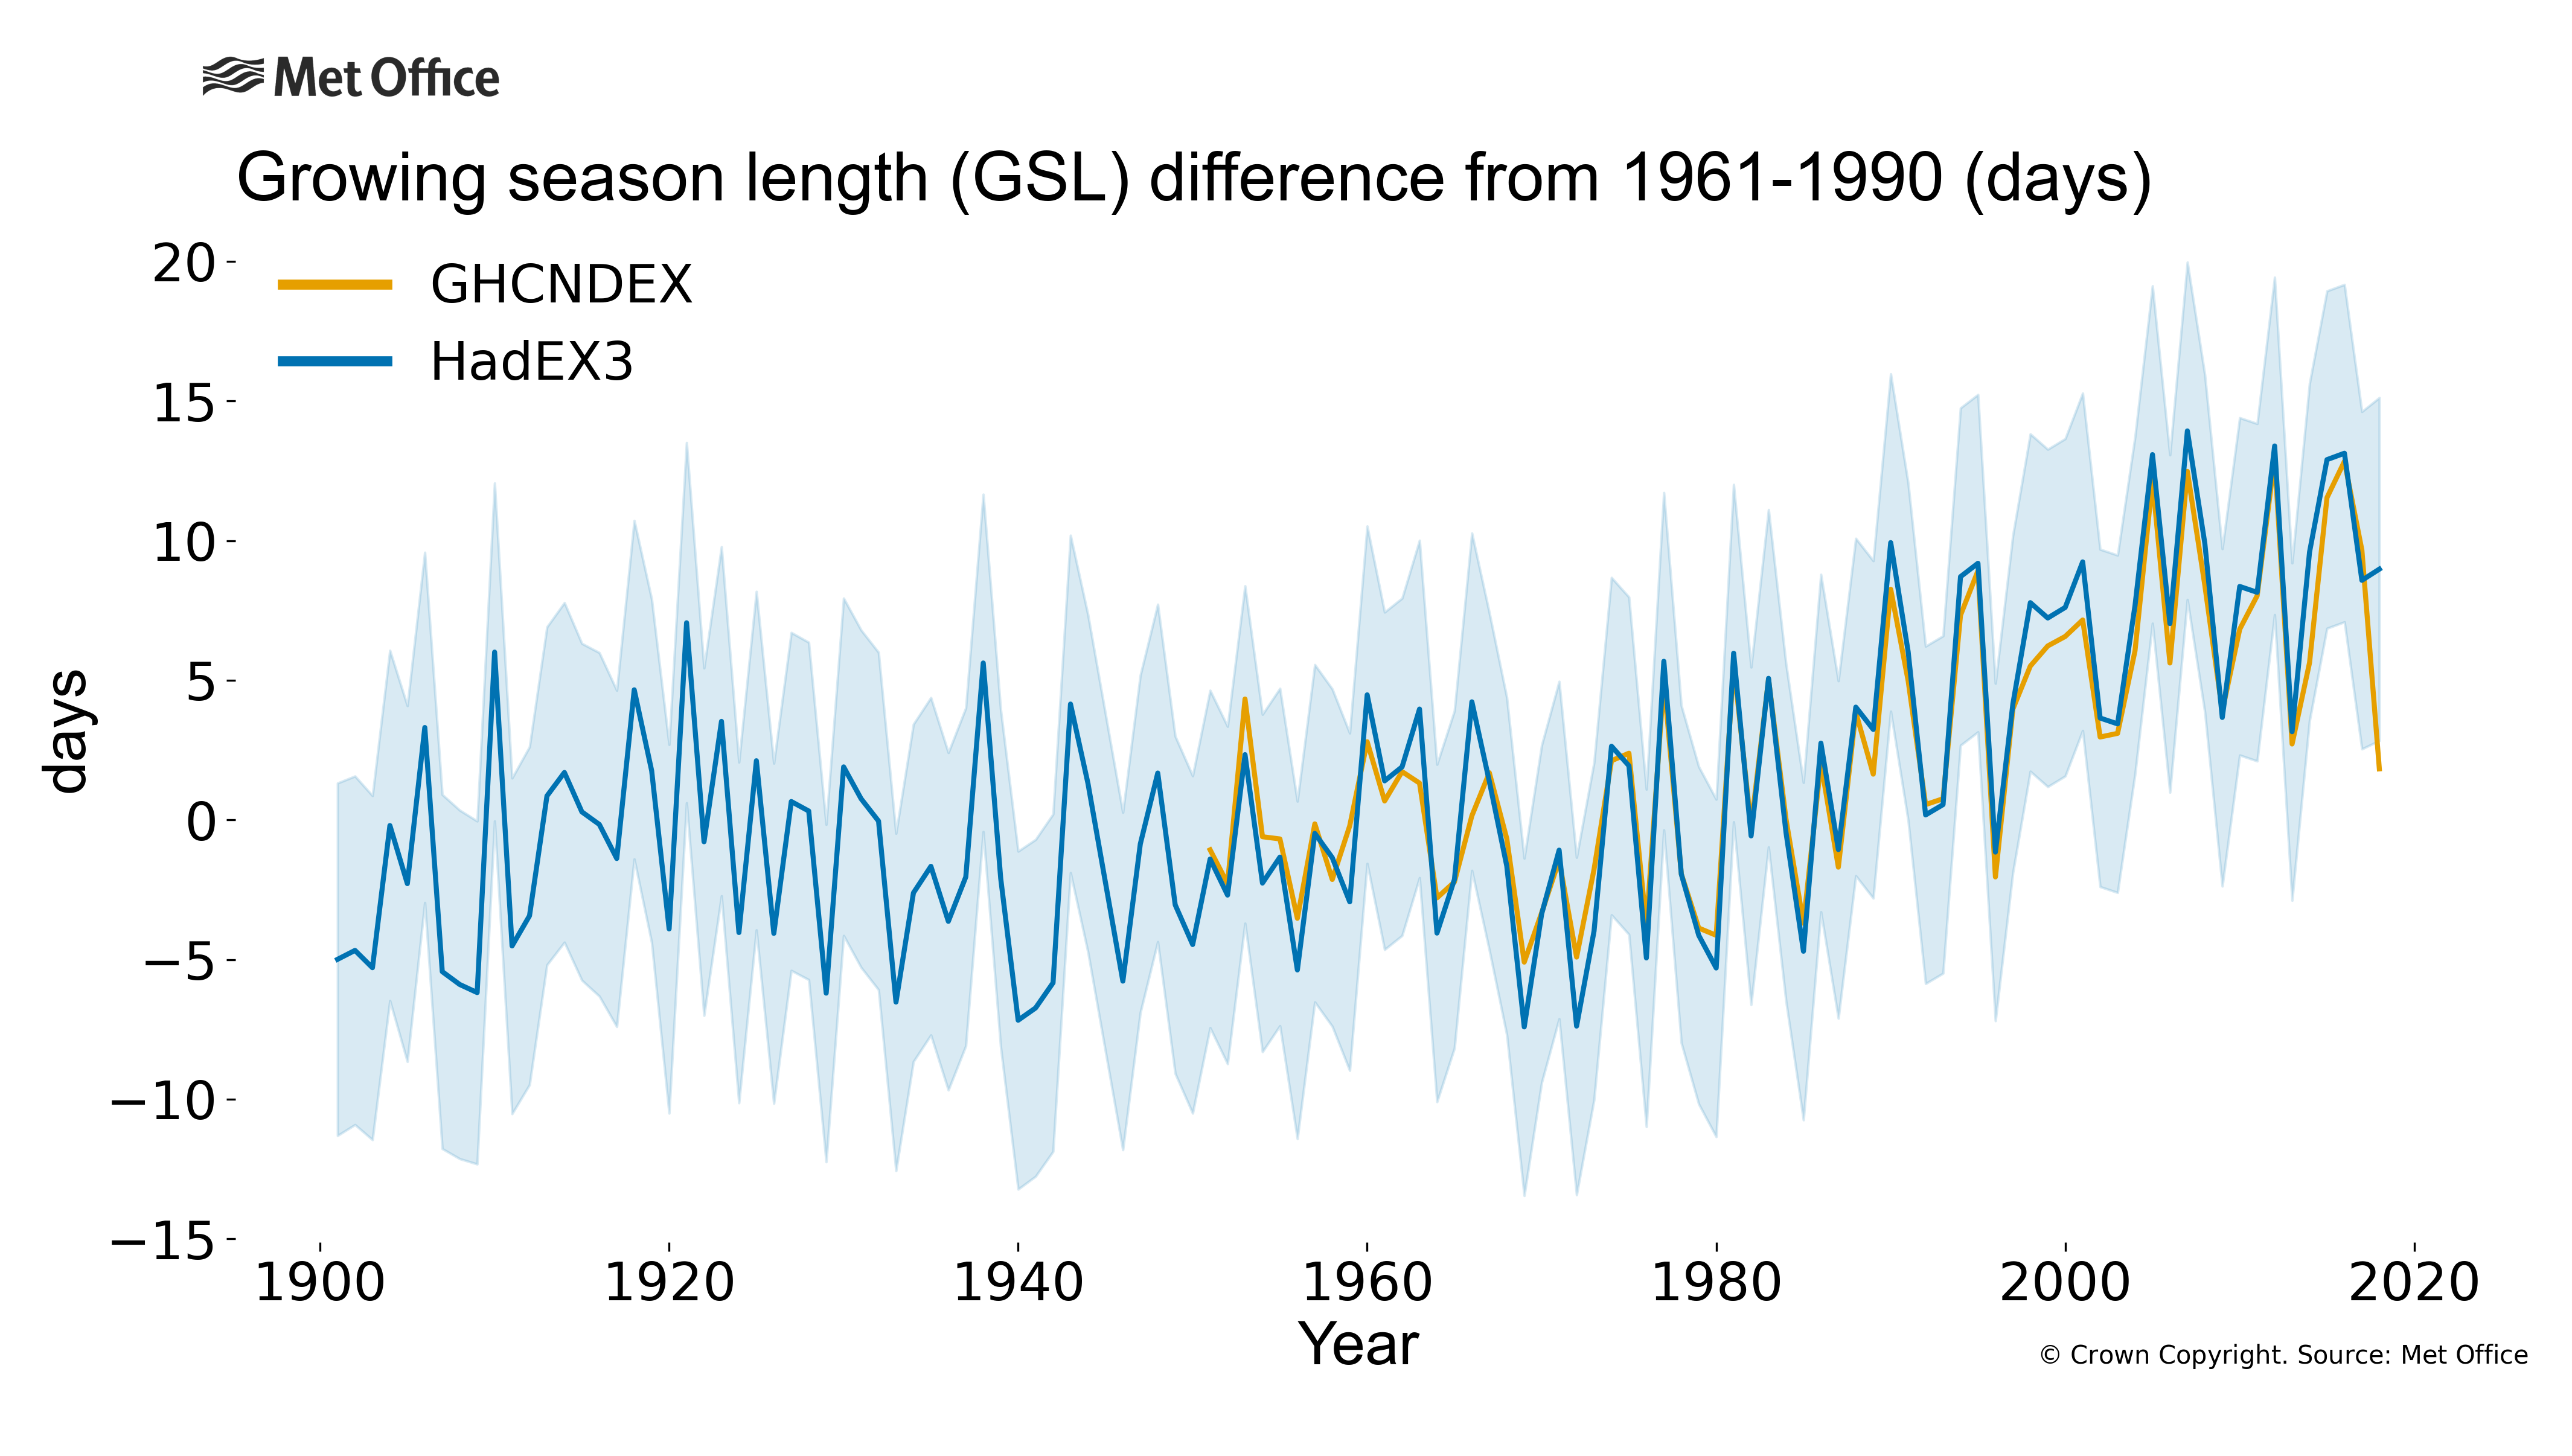
The growing season length also shows an increase since the 1970s. However this index shows much greater year-to-year variability than the other two, and so the increase does not stand out as prominently.
How are the temperature indices defined?
The warm (WSDI) and cold (CSDI) spell duration indices measure the total length of periods, greater than 6 days, where the maximum temperatures were above the 90th percentile or minimum temperatures were below the 10th percentile (1961-90).
The growing season length (GSL) is more complex, and in the northern hemisphere measures the time since the beginning of the first period after 1st January where the average temperature ([Tx+Tn]/2) is above 5°C for at least 6 days until the first period after 1st July when this falls below 5°C for at least 6 days. In the southern hemisphere, January and July are reversed. We also show this index as a difference from 1961-90.
Why have extreme temperatures changed?
The Intergovernmental Panel on Climate Change (IPCC) concluded in 2013 that “It is very likely that anthropogenic forcing has contributed to the observed changes in the frequency and intensity of daily temperature extremes on the global scale since the mid-20th century.” They also said that “it is likely that human influence has substantially increased the probability of occurrence of heatwaves in some locations.” There was not enough evidence at the time for changes in the duration of warm spells (WSDI) or cold periods (CSDI)
Find out more?
More information on climate indices can be found at climdex.org.
HadEX3 was developed in collaboration between the Met Office, ARC Centre of Excellence for Climate Extremes at the University of New South Wales, Environment and Climate Change Canada and Barcelona Supercomputing Center. For a full list of contributors, please see the journal article and the main dataset webpage for HadEX3.
- HadEX3 – www.metoffice.gov.uk/hadobs/hadex3/ , www.climdex.org – https://doi.org/10.1029/2019JD032263 and https://hadex-extremes.blogspot.com/
- GHCNDEX – www.climdex.org, https://doi.org/10.1175/BAMS-D-12-00109.1


