Why are extreme temperatures important?
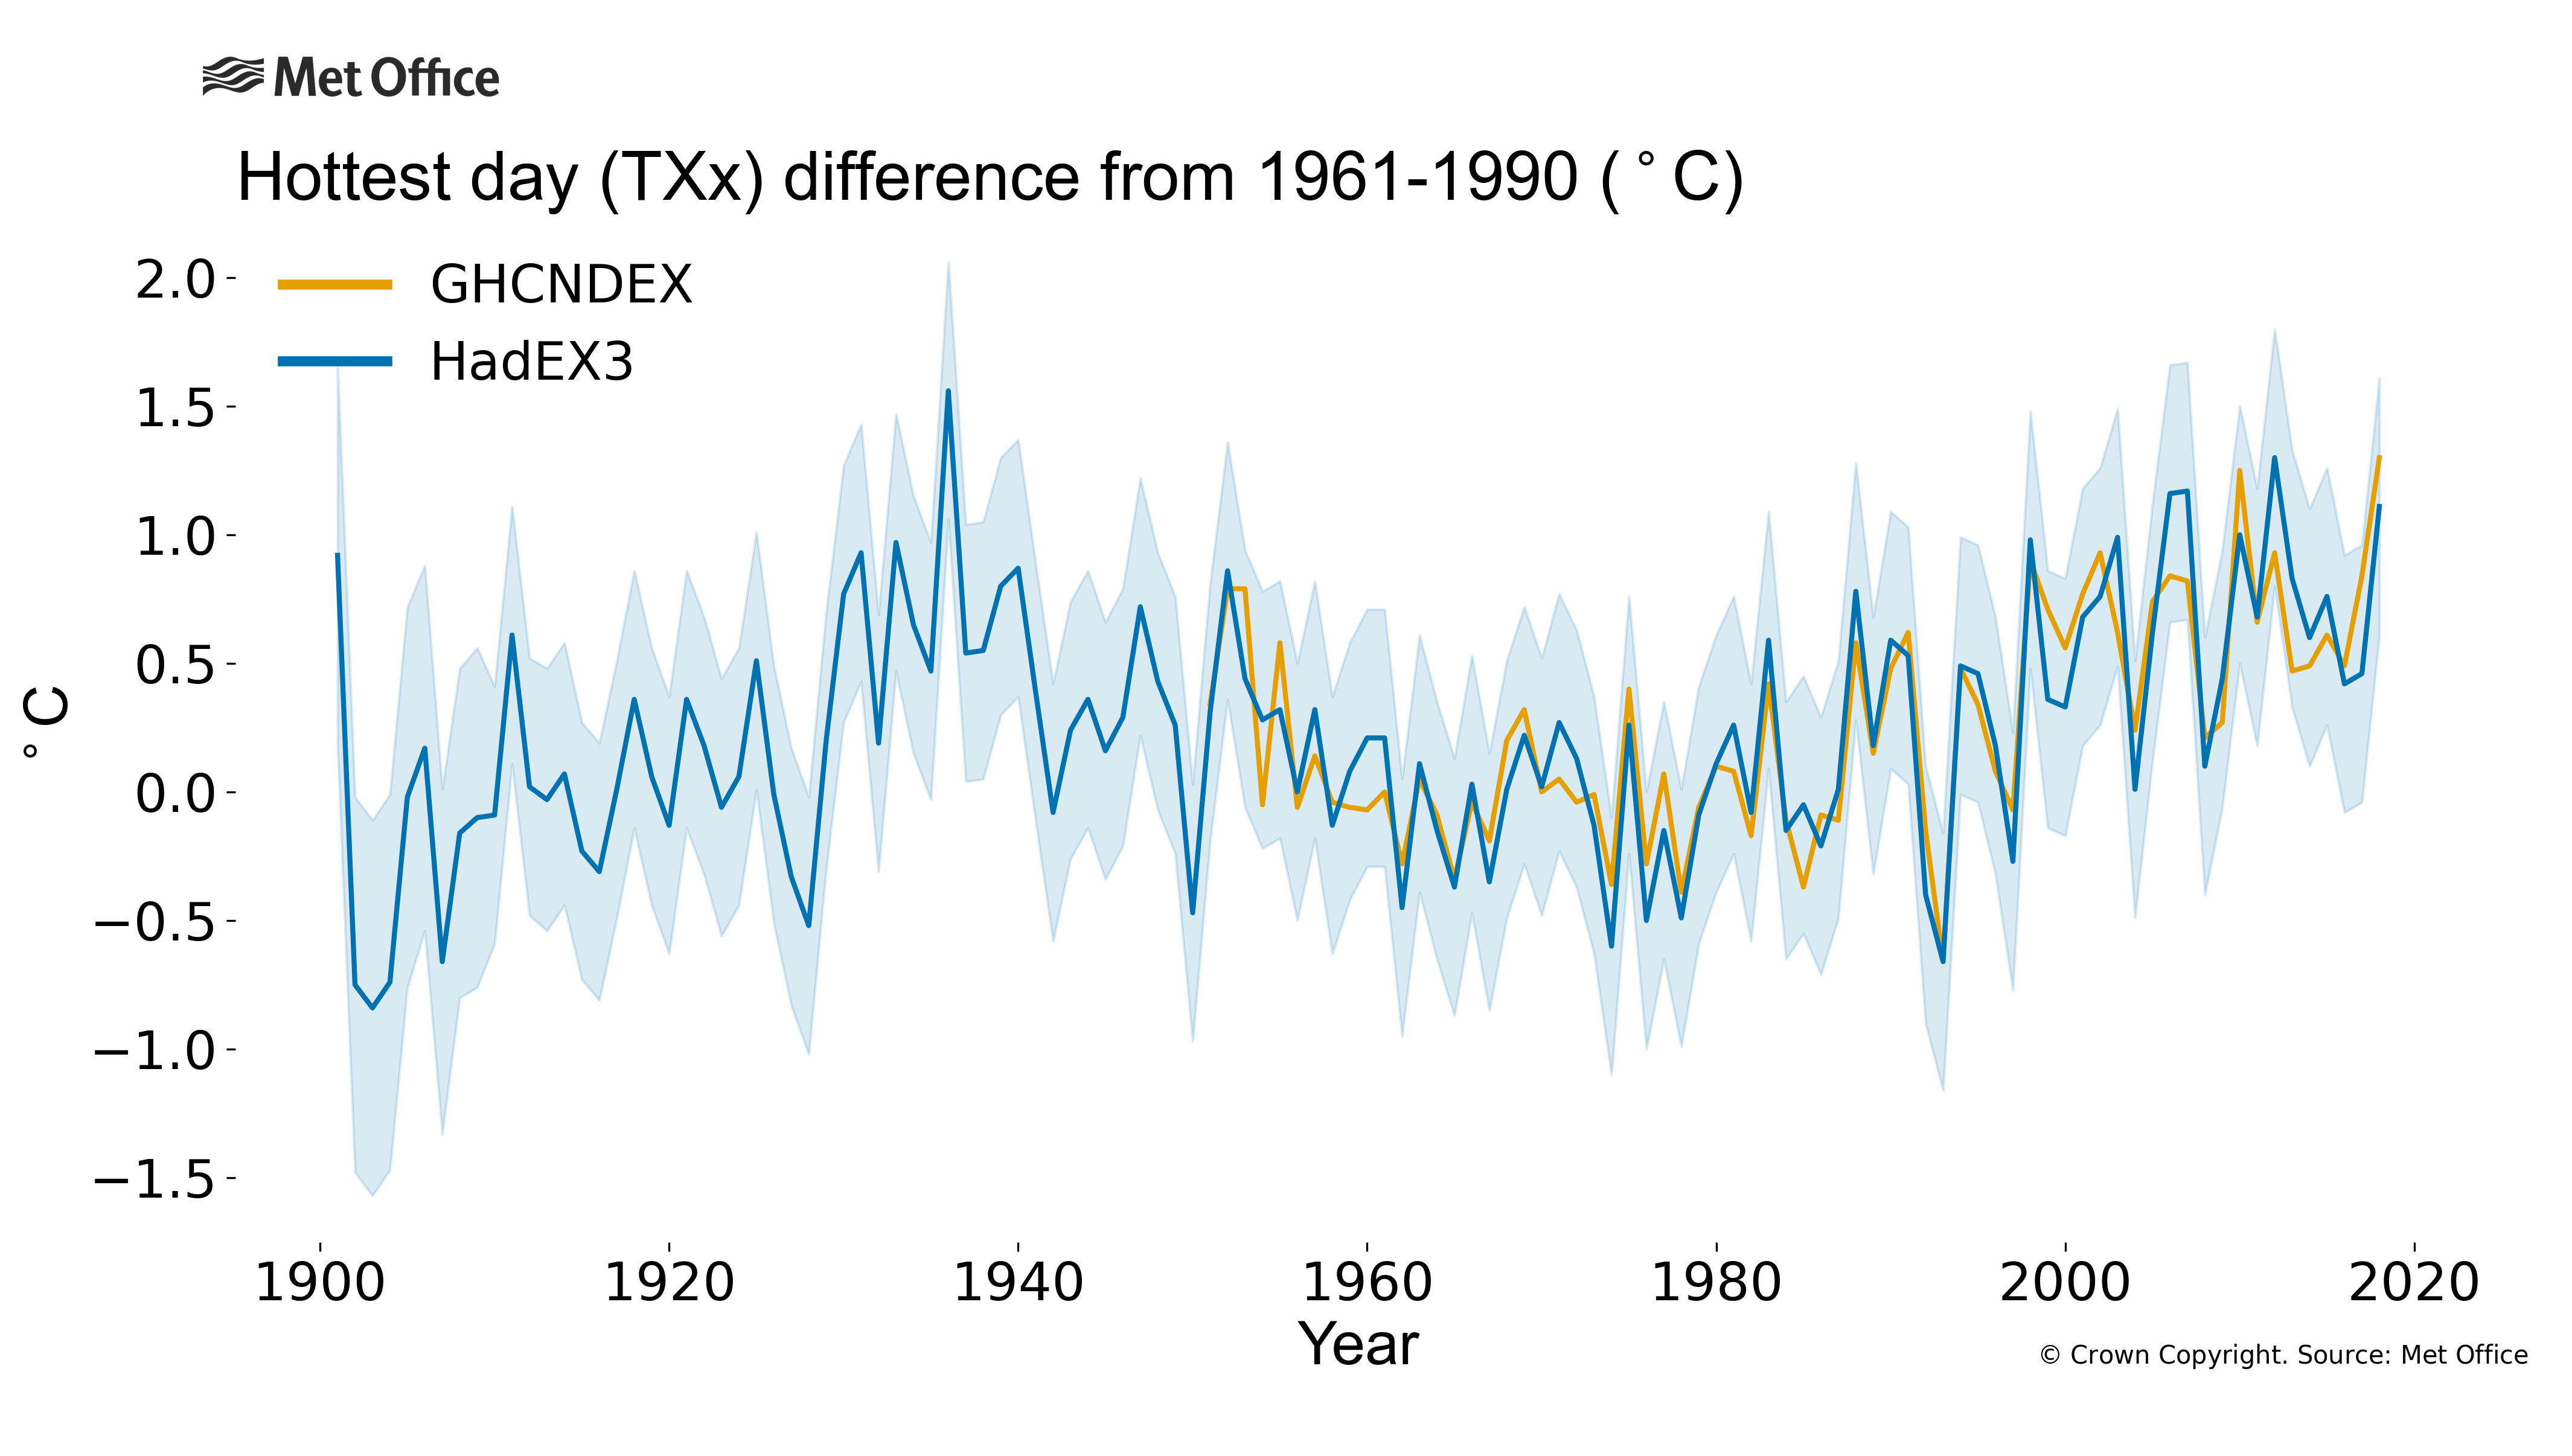
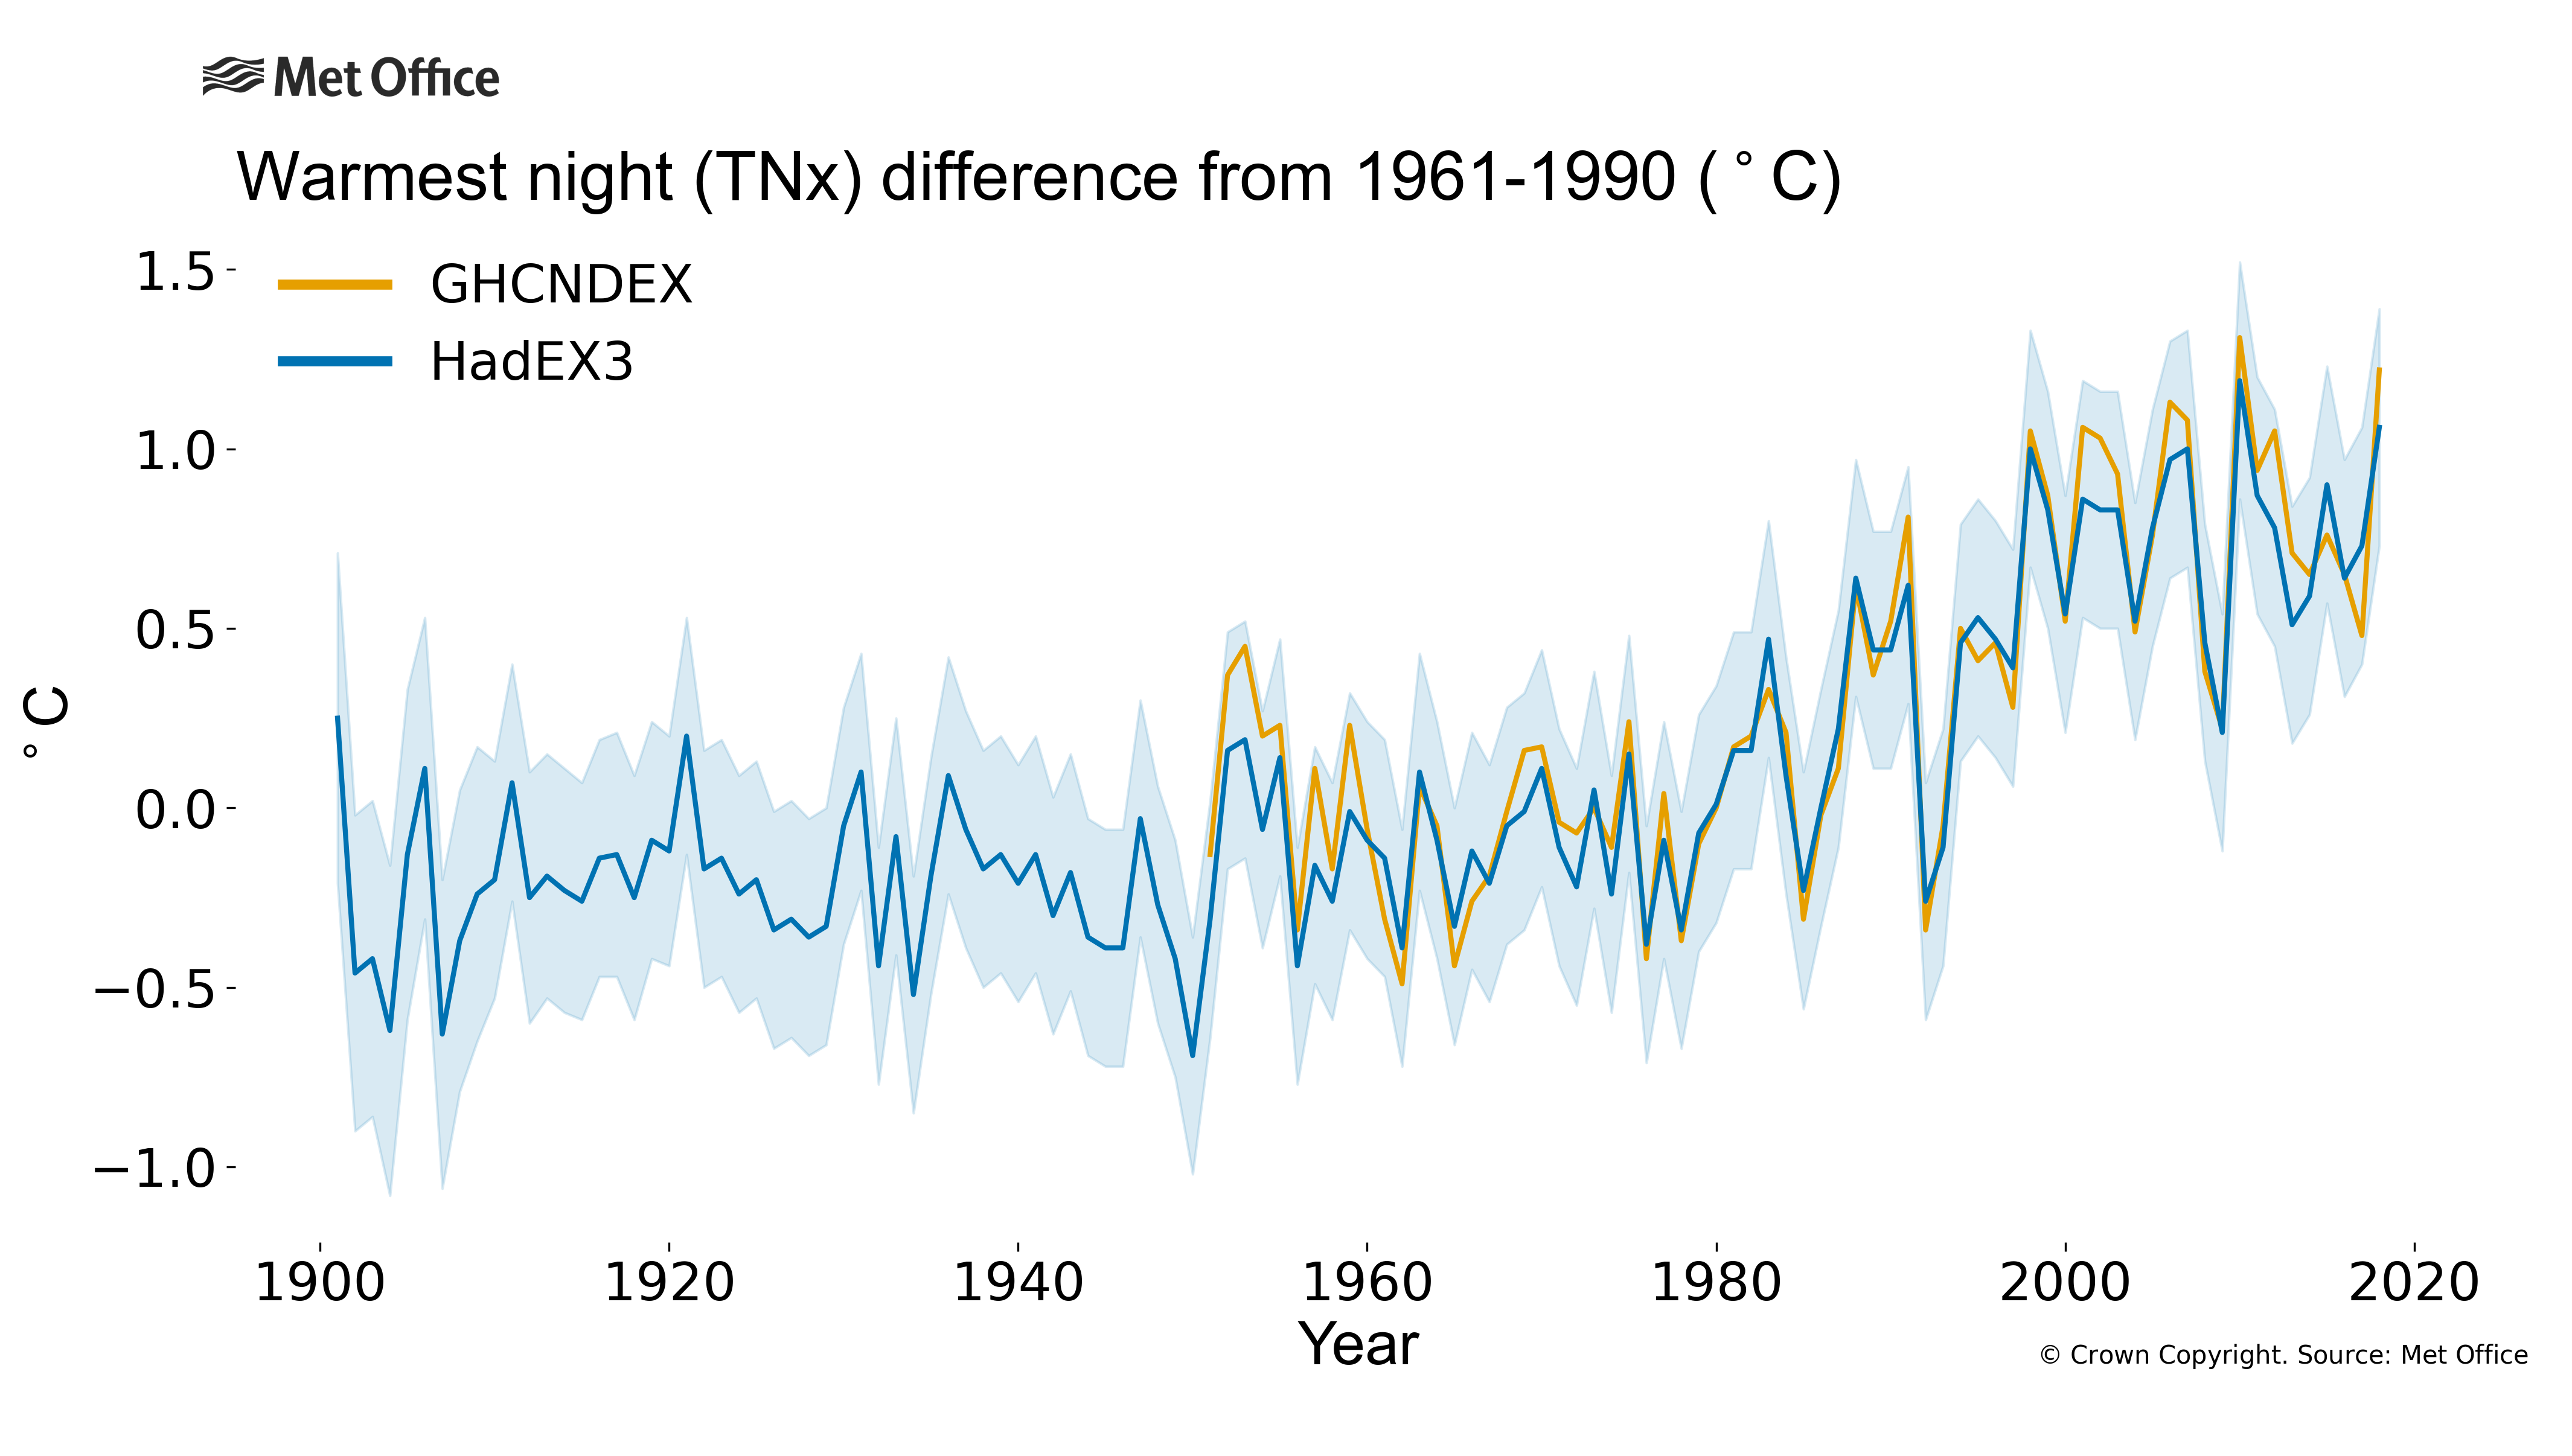
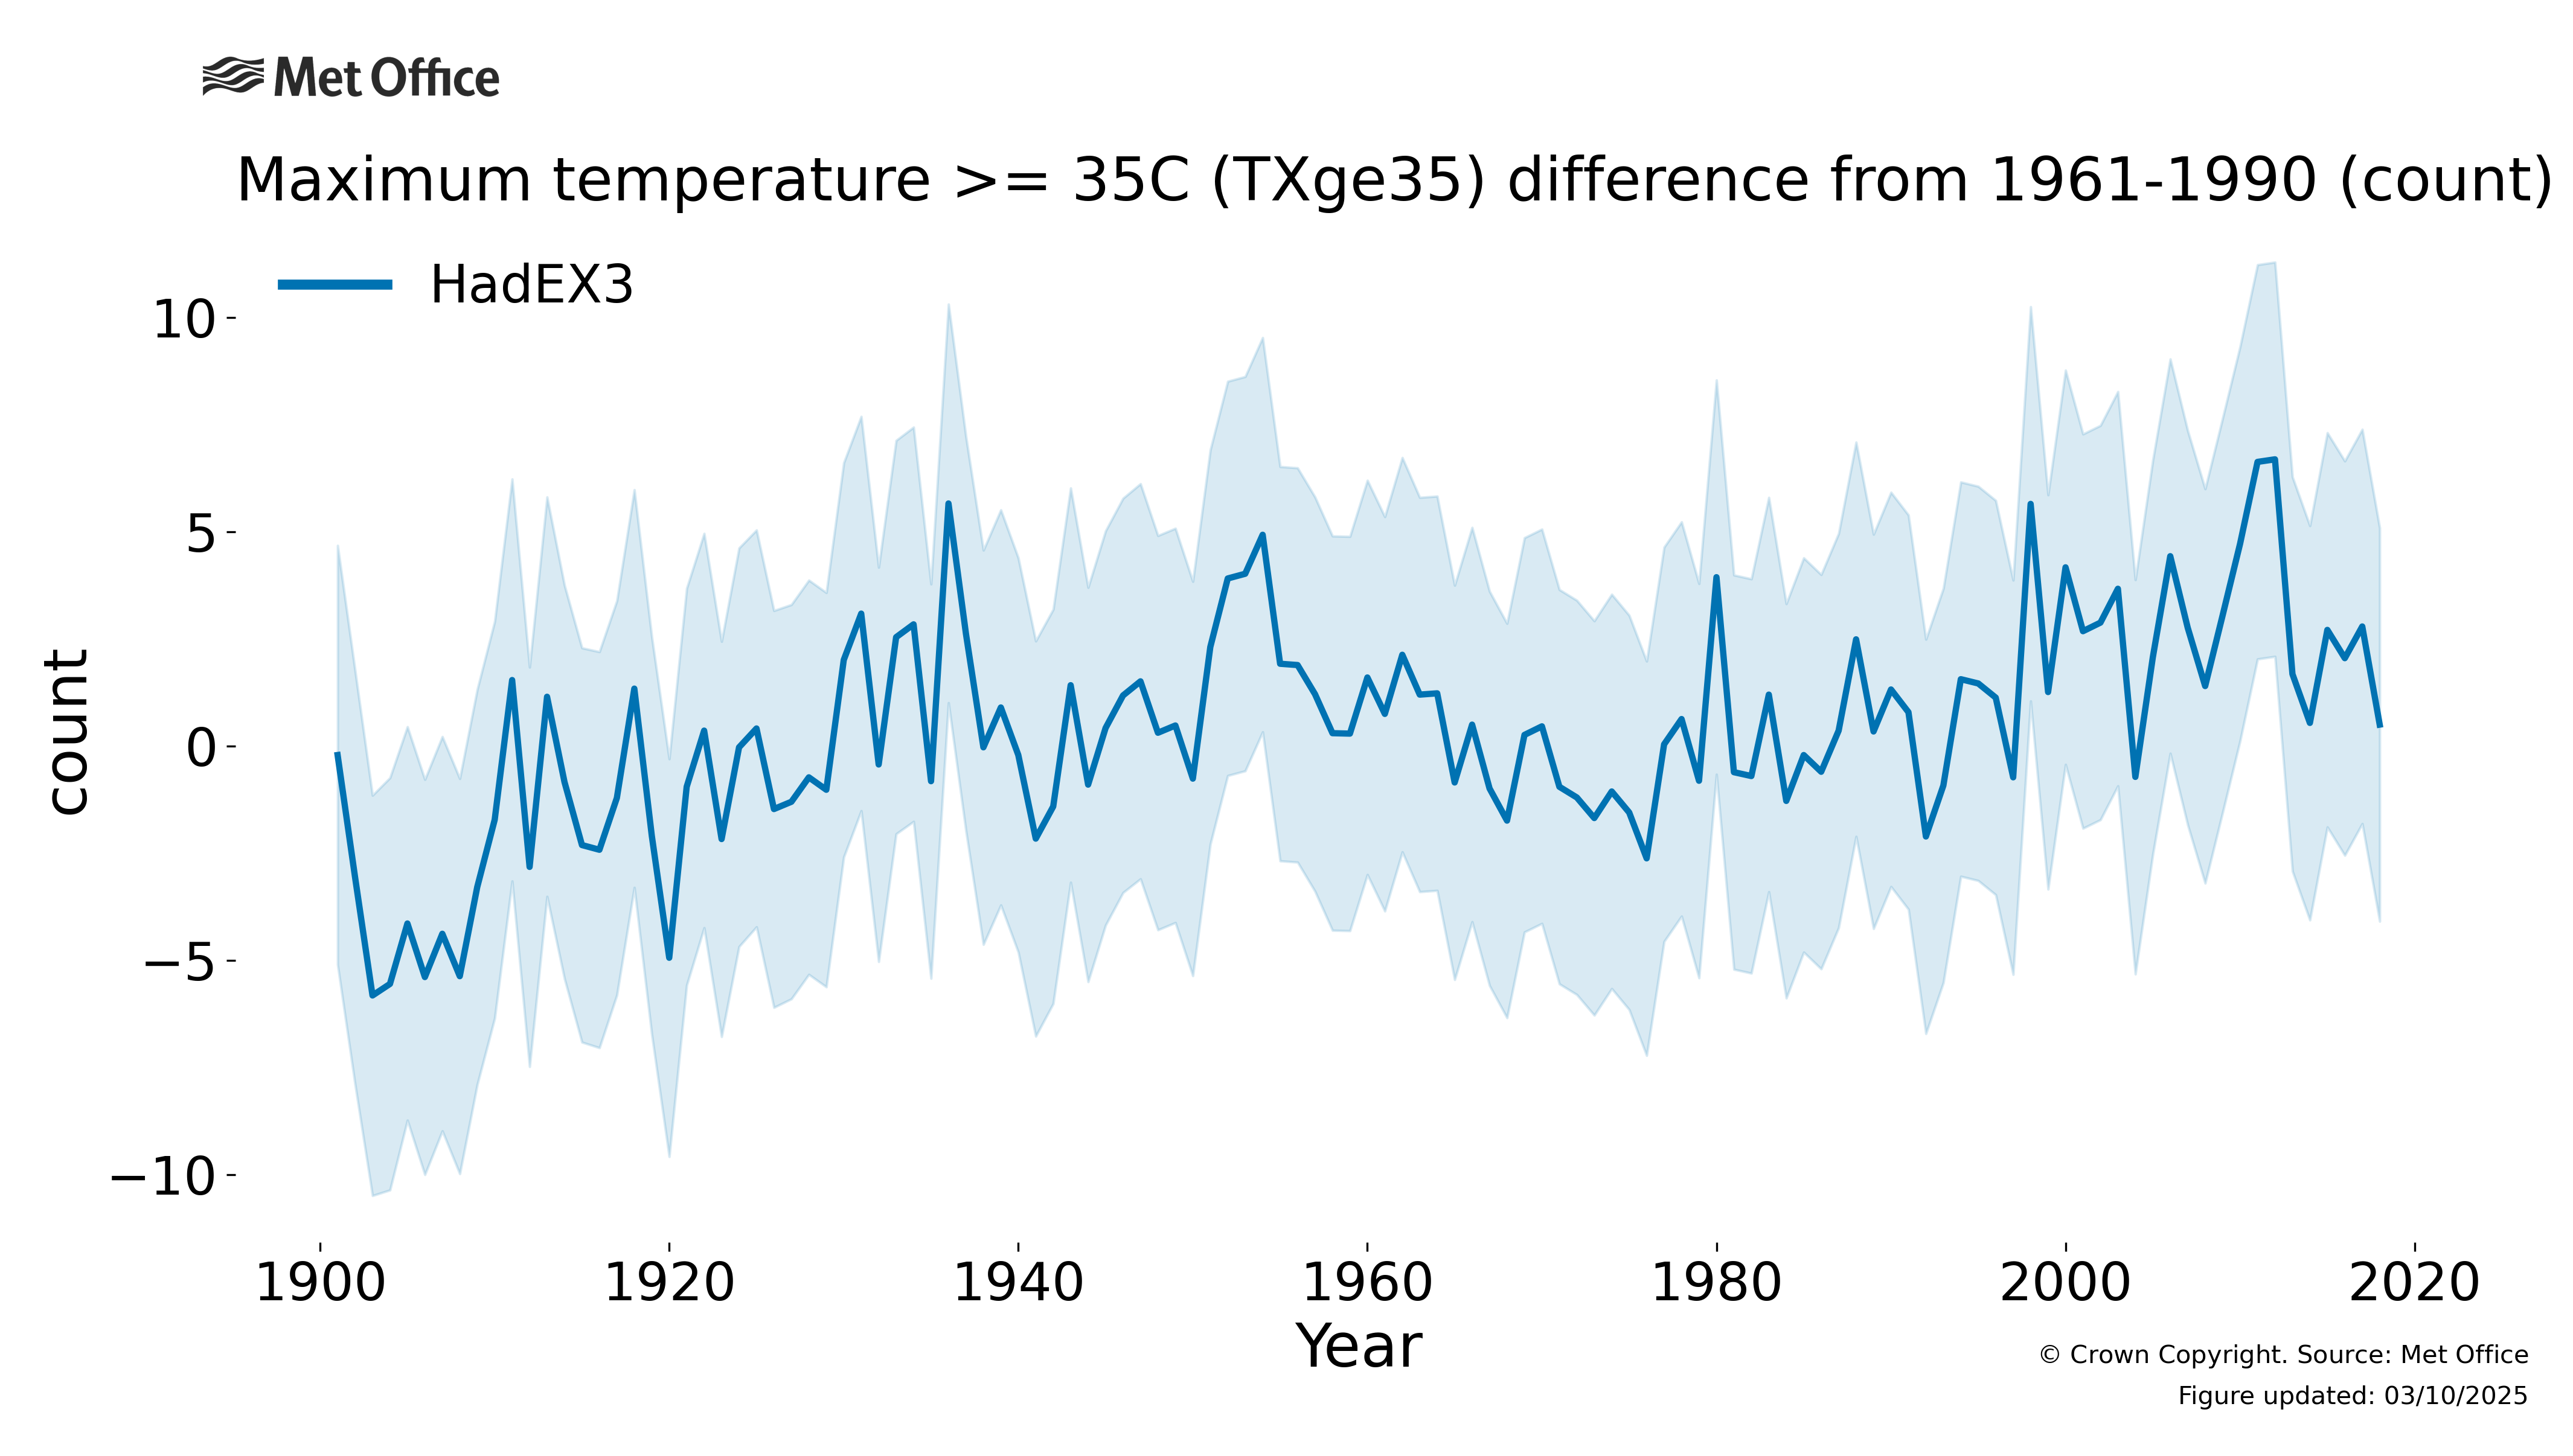
Although maybe only occurring for a single day during the peak of a heatwave or cold snap, peak temperatures, if they are intense enough, can cause extra impacts on top of those resulting from a prolonged warm or cold spell. These also measure the most intense temperatures, rather than “warm” or “cool” periods which are captured by other indices. It’s also important to measure not only the hottest day (TXx) or coldest night (TNn - not shown), but also the hottest night (TNx) and the coldest day (TXn – not shown) to get as full a picture as possible of the changes that have occurred. Although high daytime temperatures capture the imagination, elevated night-time temperatures also have human heat-health impacts, as the body's core temperature cannot return to normal levels. Hence high night-time temperatures results in a cumulative effect of hot weather and are important to study alongside the daytime ones. Counting days above a particular threshold (TXge35) provides a different viewpoint onto periods of high temperatures.
How have temperature extremes changed?
All three of these quantities have increased during the last 5 decades, and some for longer. The peak in the hottest days in the 1930s comes from the US Dust Bowl, which is disproportionately prominent as the spatial coverage of the datasets during this time is restricted to North America, Europe and Australia. The other indices show smaller increases over the same time period, but with similar variations across the 20th and 21st centuries.
How are the temperature indices defined?
These are some of the simplest indices in this collection. These indices just capture the highest or lowest maximum or minimum temperature reached during the year, or counting days where temperatures exceeded a threshold. For these global average plots, the values from all the grids are blended together and shown as a difference from the average over 1961-90.
Why have extreme temperatures changed?
The Intergovernmental Panel on Climate Change (IPCC) concluded in 2013 that “It is very likely that anthropogenic forcing has contributed to the observed changes in the frequency and intensity of daily temperature extremes on the global scale since the mid-20th century.” They also said that “it is likely that human influence has substantially increased the probability of occurrence of heatwaves in some locations.”
The indices presented on this page measure the intensity of heatwaves (TXx, TNx, TXge35), and so changes in these are very likely to have come from the emission of greenhouse gases and other human activities with impacts on our climate.
Find out more?
More information on climate indices can be found at climdex.org.
HadEX3 was developed in collaboration between the Met Office, ARC Centre of Excellence for Climate Extremes at the University of New South Wales, Environment and Climate Change Canada and Barcelona Supercomputing Center. For a full list of contributors, please see the journal article and the main dataset webpage for HadEX3.
- HadEX3 – www.metoffice.gov.uk/hadobs/hadex3/ , www.climdex.org – https://doi.org/10.1029/2019JD032263 and https://hadex-extremes.blogspot.com/
- GHCNDEX – www.climdex.org, https://doi.org/10.1175/BAMS-D-12-00109.1


