Why is extreme rainfall important?
Impacts from extreme rainfall can occur in a variety of ways. Short, intense events can lead to flash flooding, with large quantities of rain falling in a single day or over a few days. Prolonged steady rainfall, as measured by these indices, can build up accumulations which lead to saturated ground and flooding as large rivers progressively break their banks.
Large rainfall accumulations over a longer time period (not flash flooding from a few days) can have severe impacts on our environment, if rivers, lakes and reservoirs cannot cope with all the water, and break their banks, leading to flooding. As the volumes of water can be much larger than for a short timescale event, these floods and other impacts can last for longer and affect a larger area.
As well as severe impacts, by measuring the accumulation of rainfall, these indices can give a measure of how “good” or “bad” a rainy season was. Where regions have defined wet(ter) and dry(ier) seasons, these indices can be used as indicators of drought arising through low rainfall, though other indices monitor this more accurately as other factors – such as temperature, soil moisture and humidity – also play a part in drought conditions.
How has extreme rainfall changed?
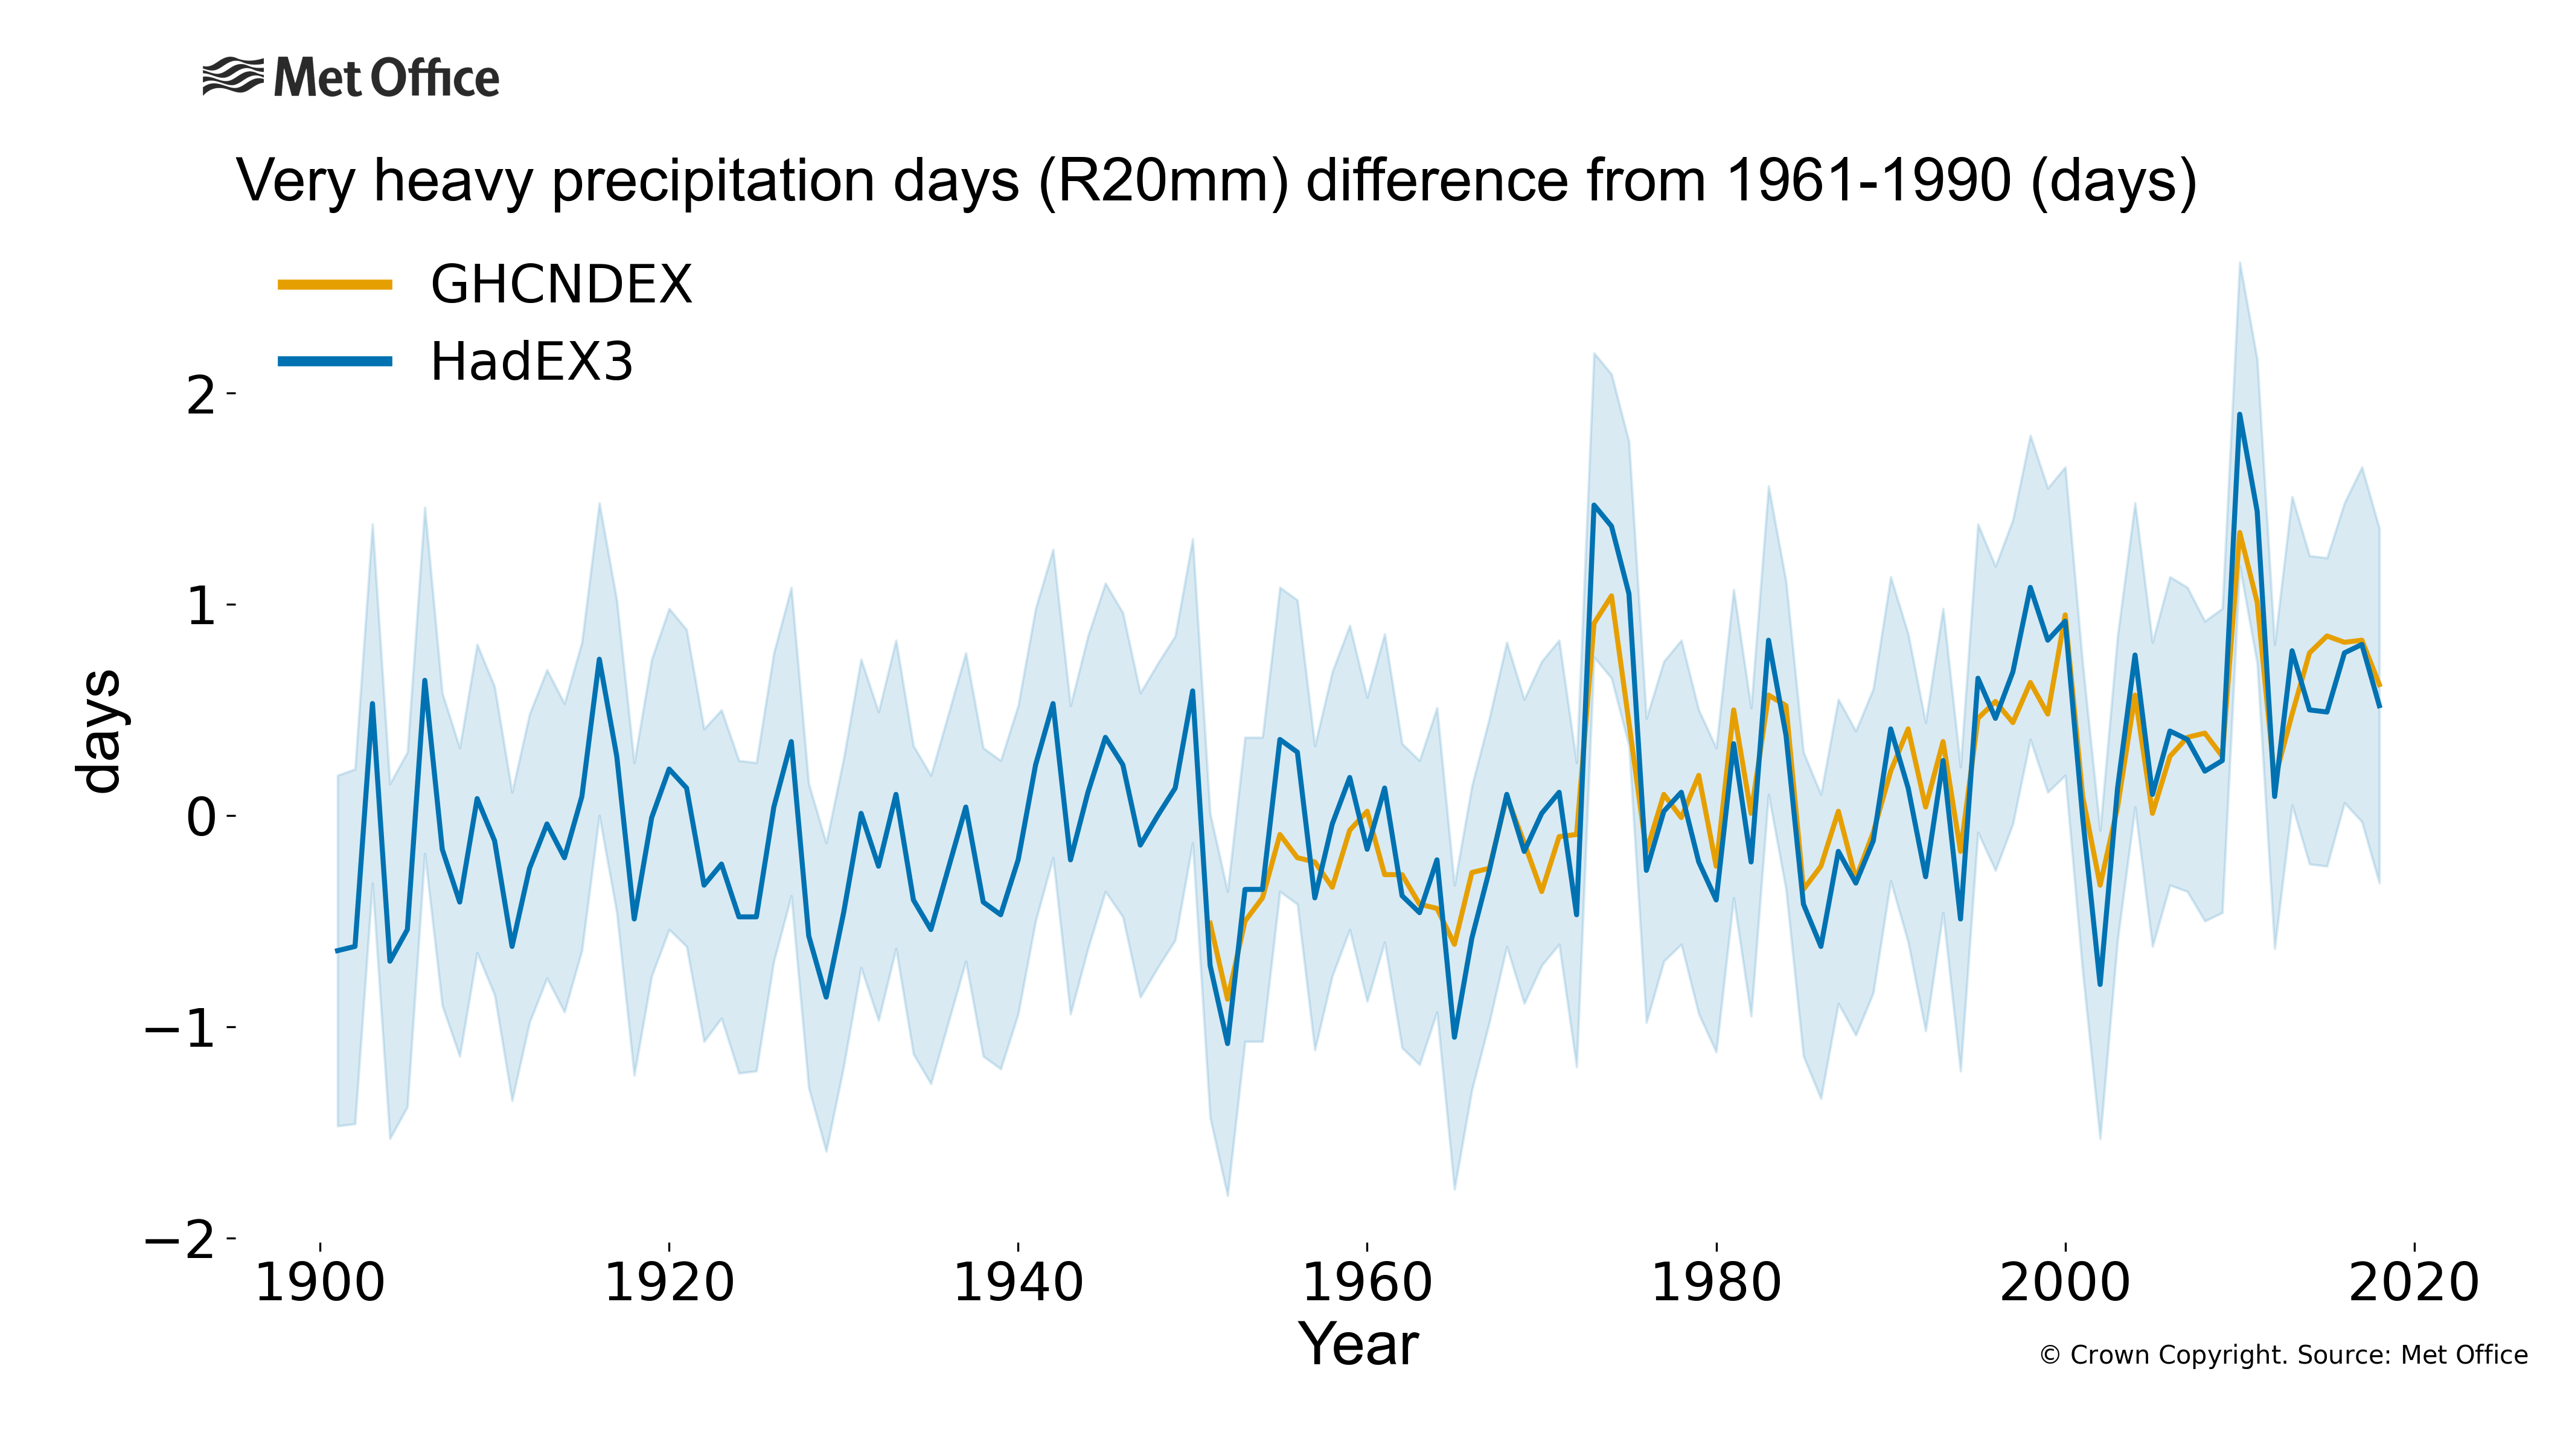
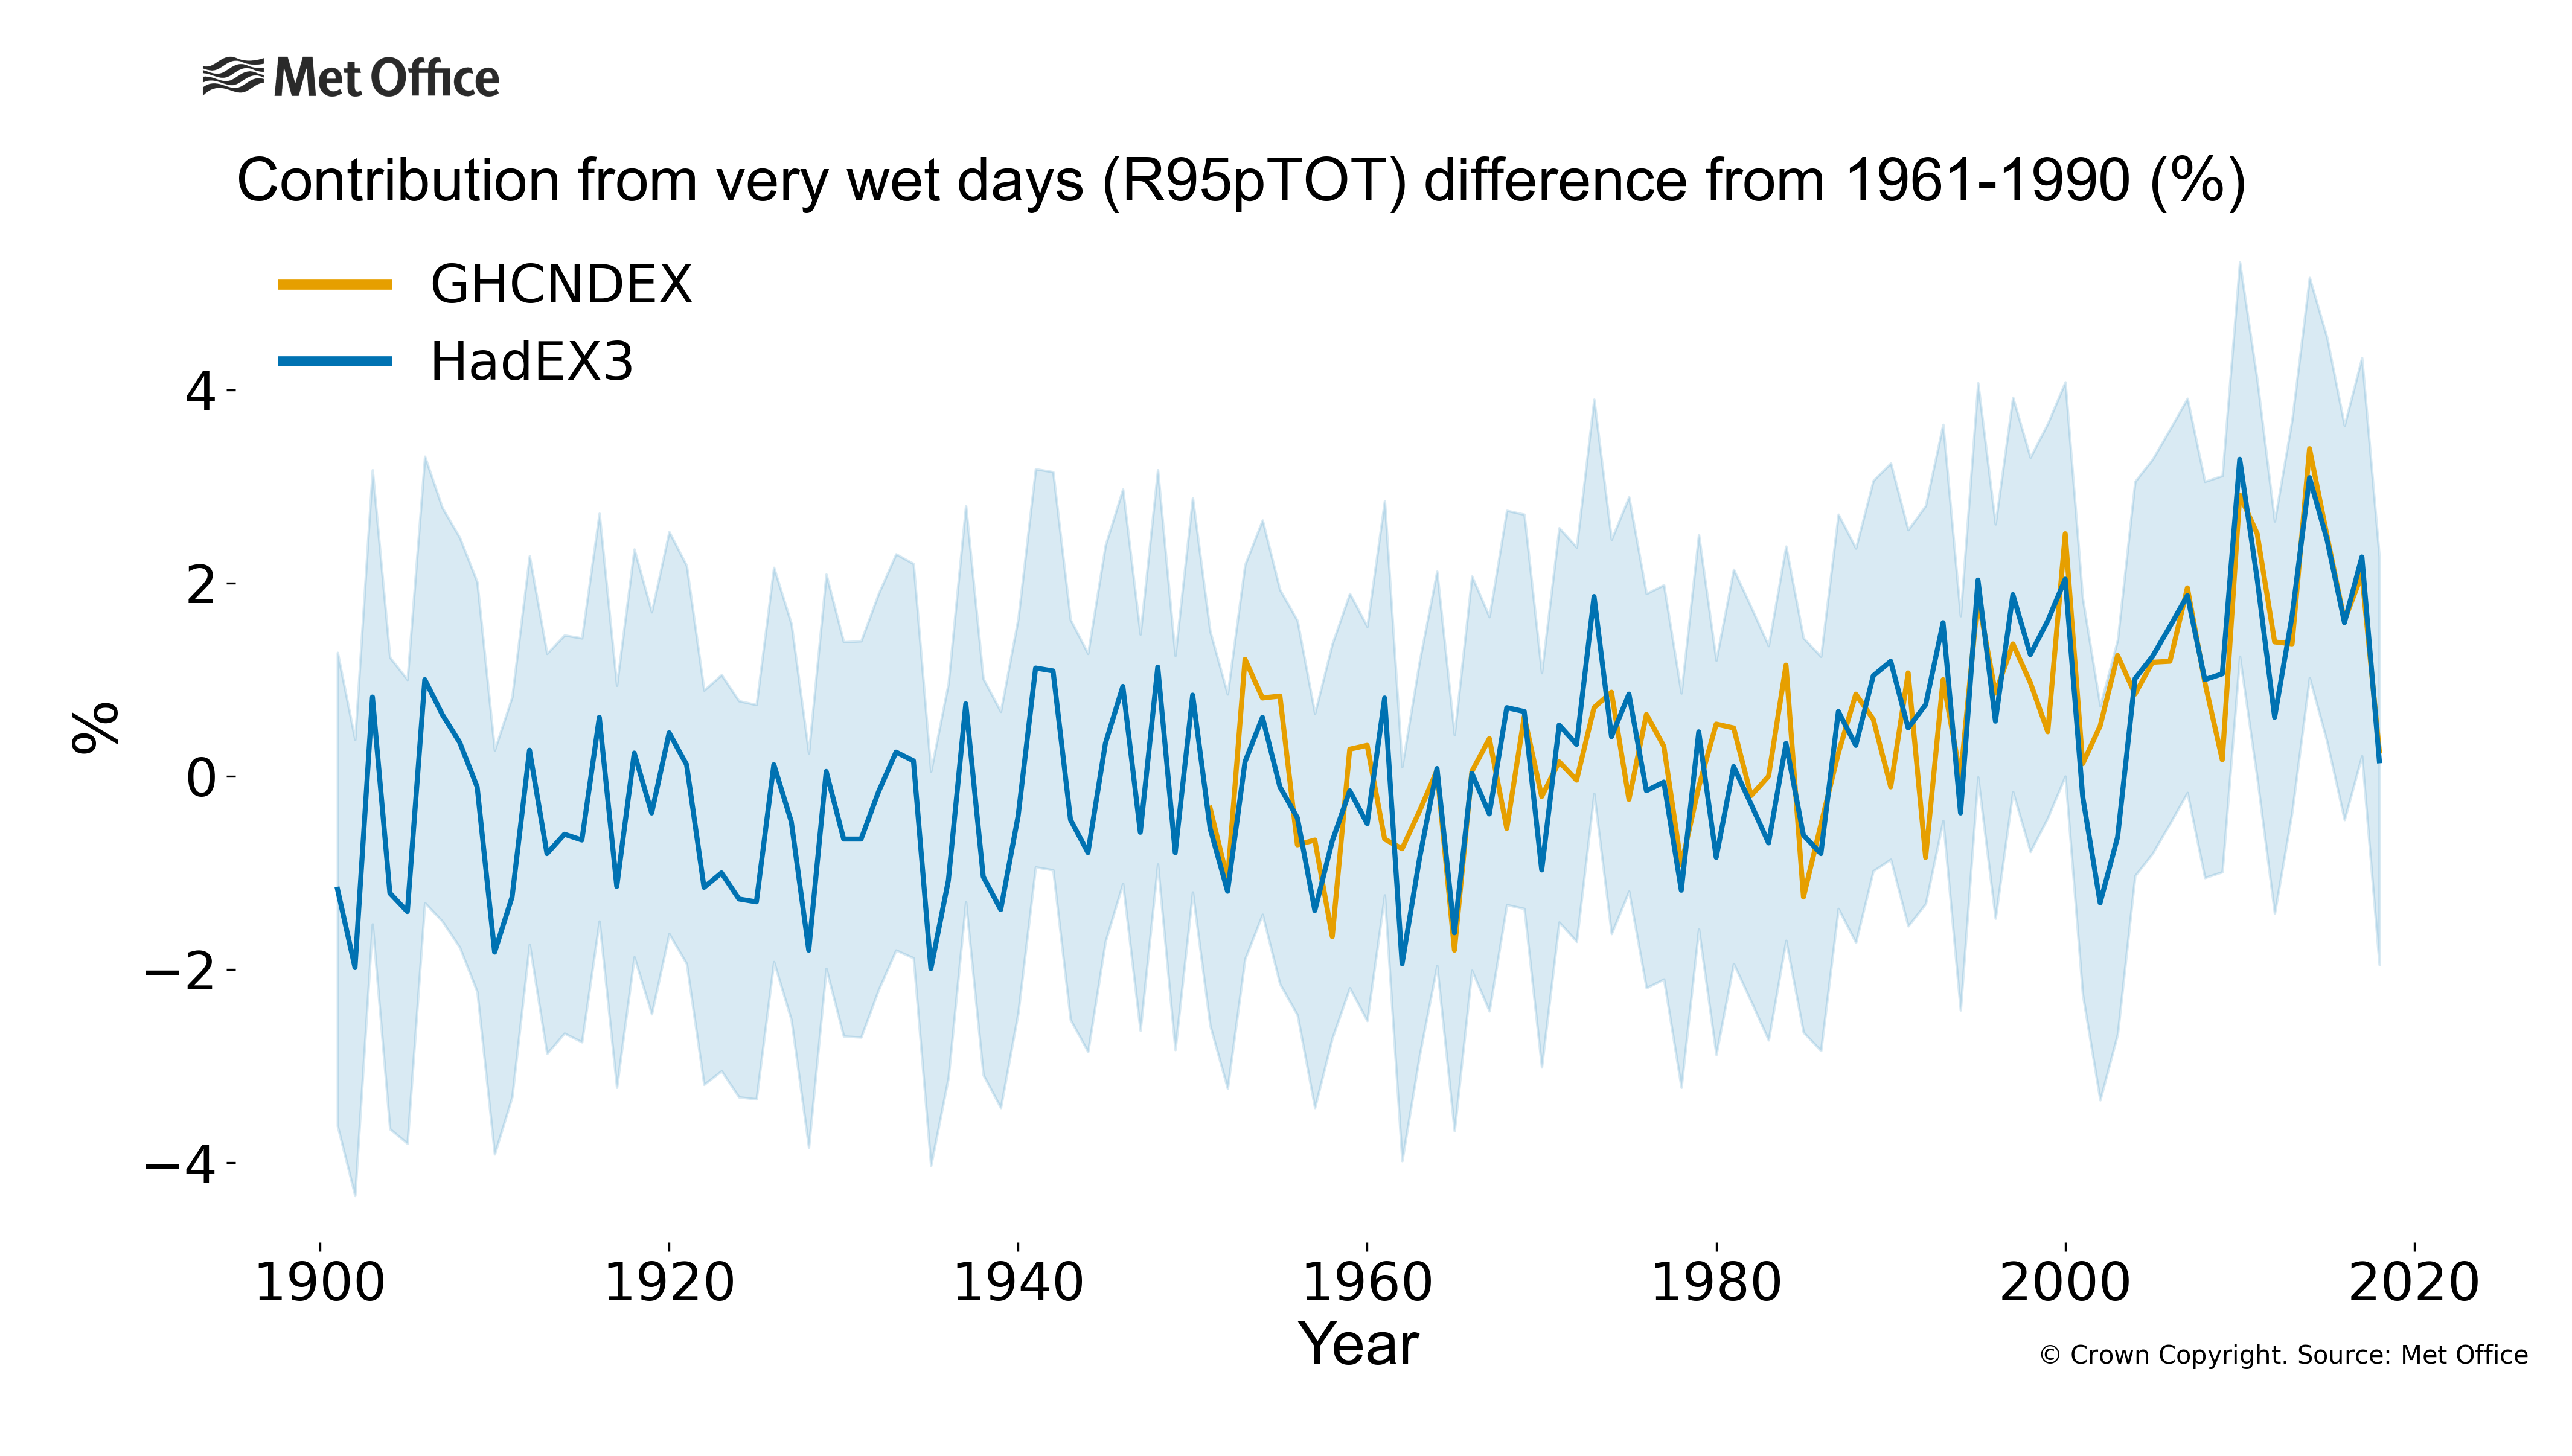
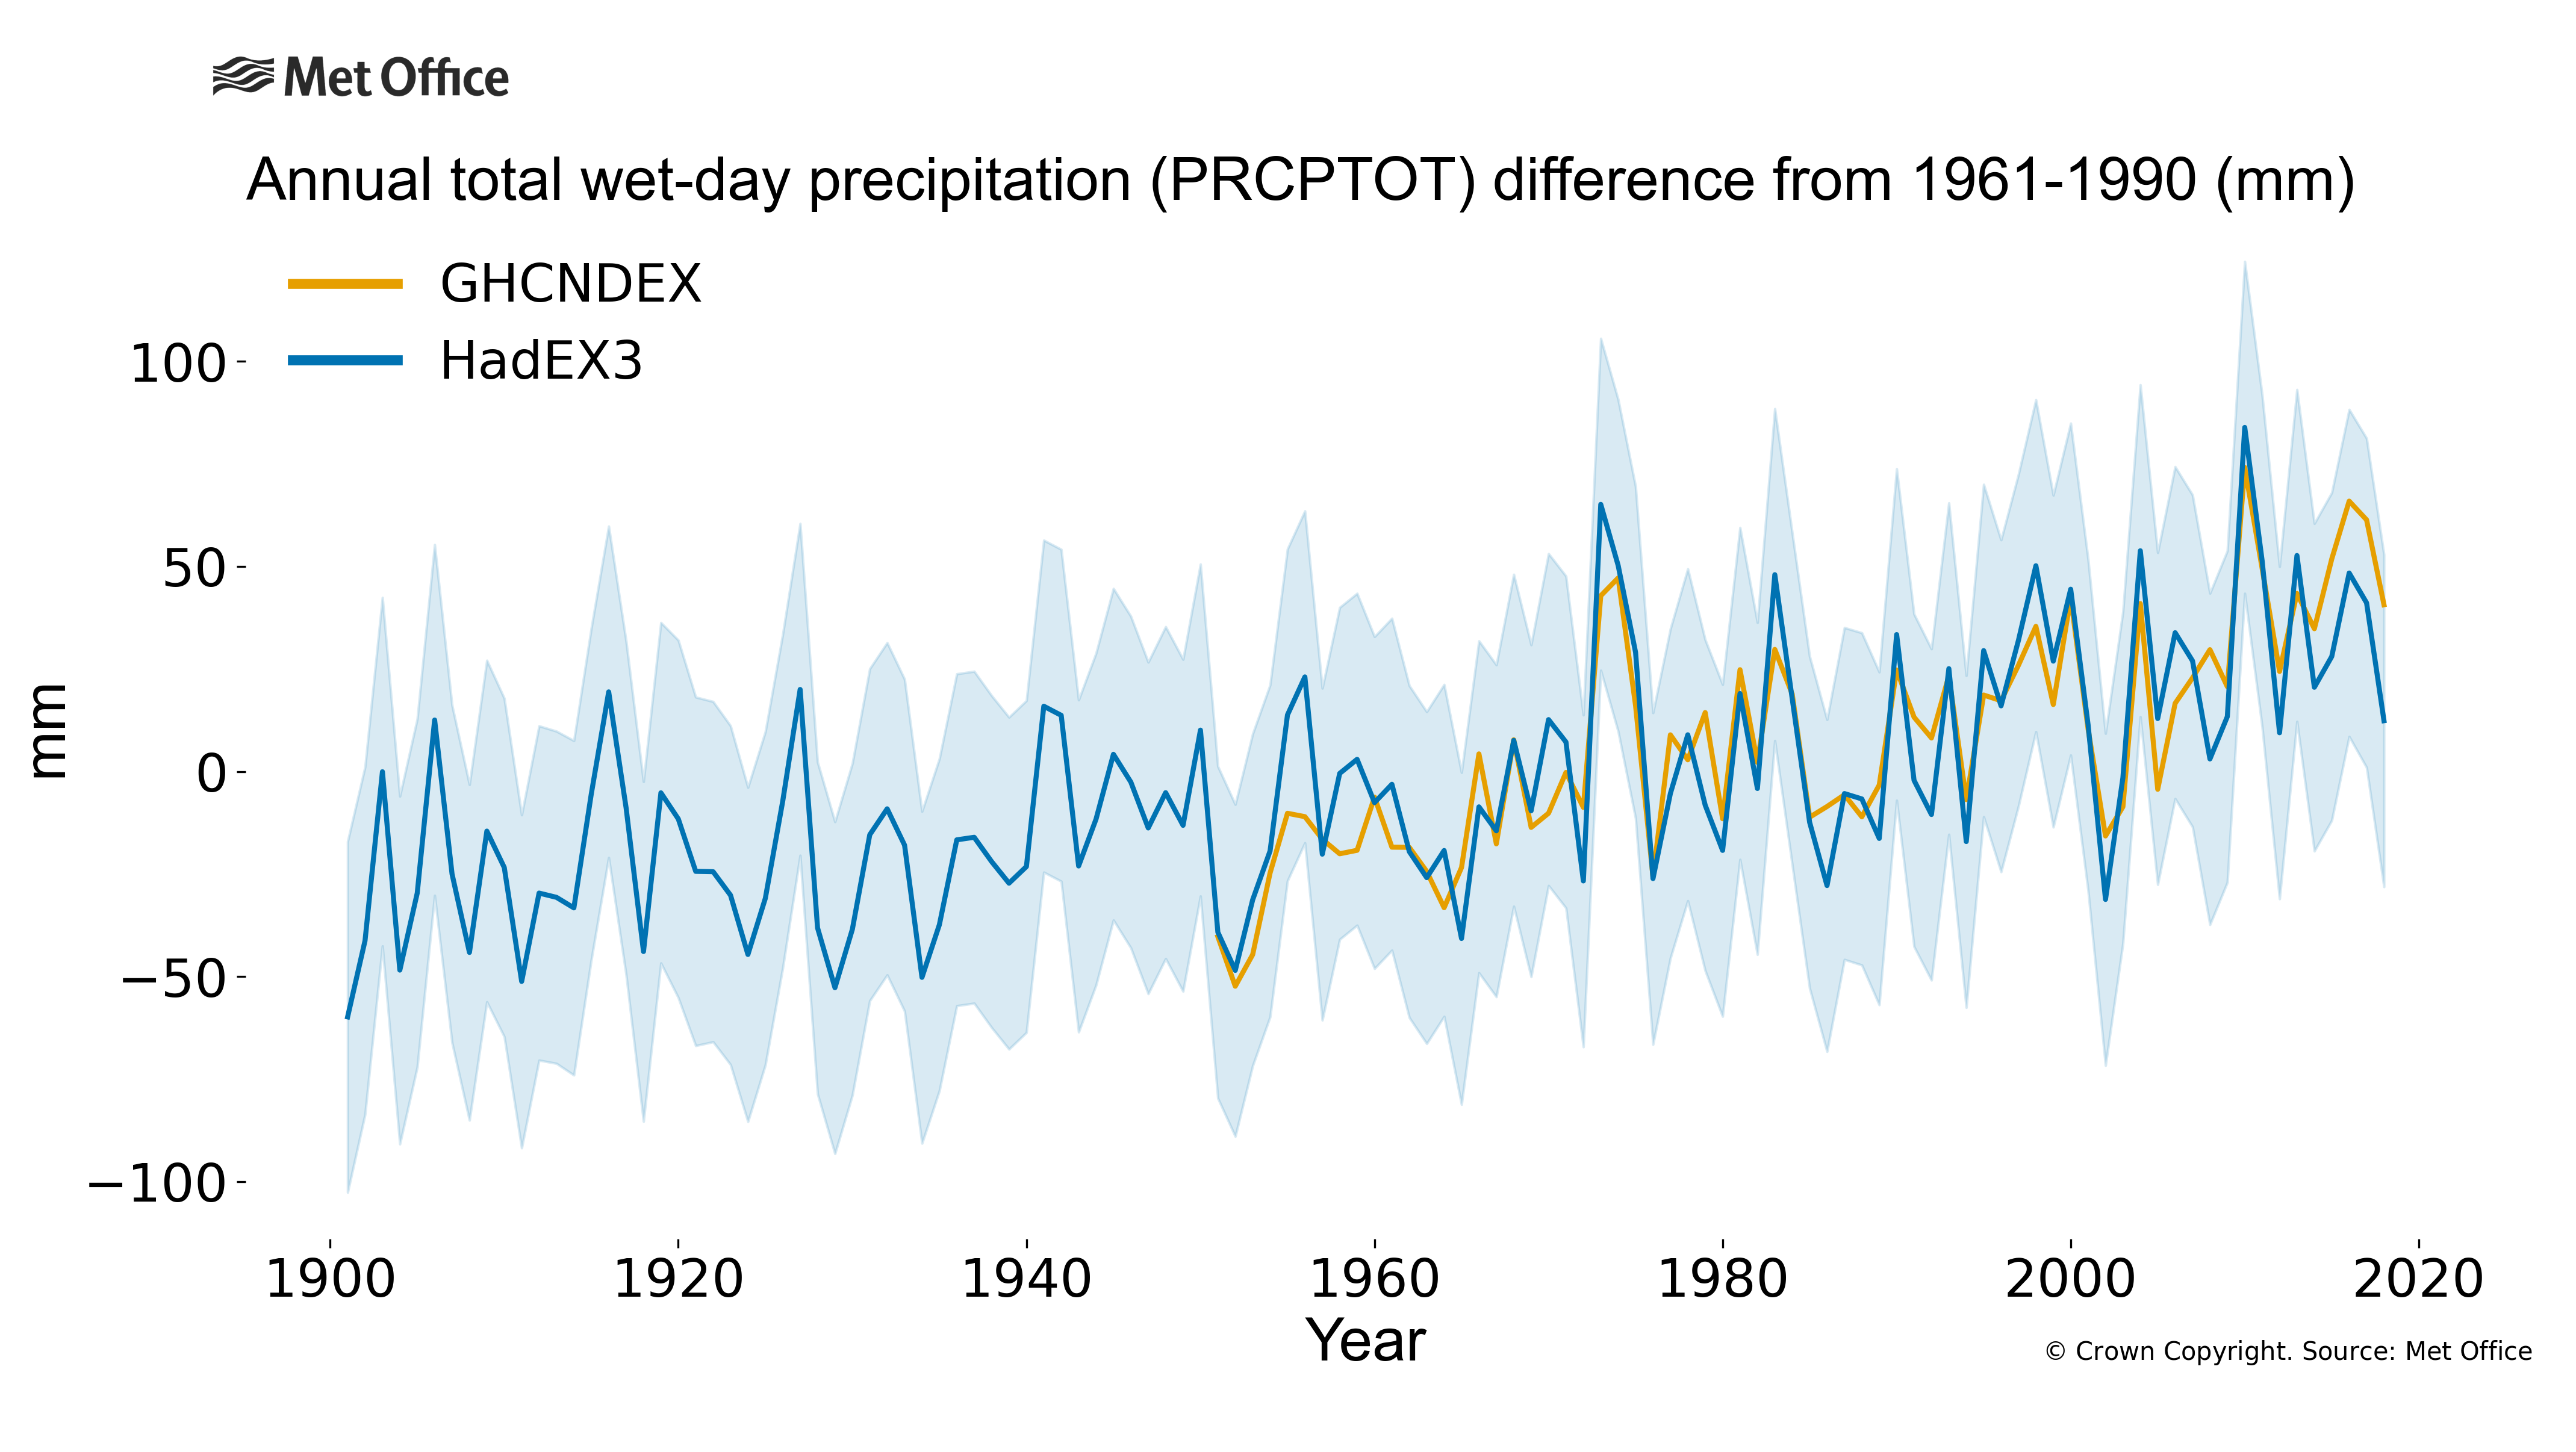
One index (total annual precipitation) shows a clear increase since the beginning of the 20th Century. There has been a gentler increase in the number of heavy rainfall days and only slight indications of an increase in the length of the longest wet spell since the beginning of the 20th Century. As rainfall can be a much more localised phenomenon, especially for convective events which are likely to result in the intense downpours assessed by these indices, there is a greater spatio-temporal variation in these indices. Therefore, the greater year-to-year variability compared to the temperature indices is expected.
On a global average, we see that there has been an increase of an extra half-day (so one extra day every two years) where the rainfall was over 20mm. But the increase in the total annual precipitation is over 50mm since the beginning of the 20th century. Changes in the SPI are harder to determine as before the middle of the last century, spatial coverage differences dominate the "globally" averaged signal.
How are the extreme rainfall indices defined?
The total precipitation which falls over the year (PRCPTOT) is a simple sum of all daily totals. R20mm counts the number of days when more than 20mm fell within a rain-day. Of course, there are some parts of the world where 20mm falling in a single day is a very rare event (e.g. desert regions) and in such places this index may not show useful information.
Why has extreme rainfall changed?
The Intergovernmental Panel on Climate Change (IPCC) concluded in 2013 that “In land regions where observational coverage is sufficient for assessment, there is medium confidence that anthropogenic forcing has contributed to a global-scale intensification of heavy precipitation over the second half of the 20th century.“ They also say that “There is medium confidence that there is an anthropogenic contribution to observed increases in atmospheric specific humidity since 1973 and to global scale changes in precipitation patterns over land since 1950”.
The indices presented on this page measure the number of days with heavy rainfall (R20mm) and also total annual precipitation ( PRCPTOT) and so changes in this may have come from the emission of greenhouse gases and other human activities with impacts on our climate.
Find out more?
More information on climate indices can be found at climdex.org.
HadEX3 was developed in collaboration between the Met Office, ARC Centre of Excellence for Climate Extremes at the University of New South Wales, Environment and Climate Change Canada and Barcelona Supercomputing Center. For a full list of contributors, please see the journal article and the main dataset webpage for HadEX3.
- HadEX3 – www.metoffice.gov.uk/hadobs/hadex3/ , www.climdex.org – https://doi.org/10.1029/2019JD032263 and https://hadex-extremes.blogspot.com/
- GHCNDEX – www.climdex.org, https://doi.org/10.1175/BAMS-D-12-00109.1


