Why is thermal expansion important for understanding sea level?
The oceans are currently warming, and substantial further warming is "locked in" due to the slow ocean response to climate forcings. When water warms it expands, causing sea levels to rise. Thermal expansion is responsible for 50% of the observed sea level rise in the period 1971 - 2018.
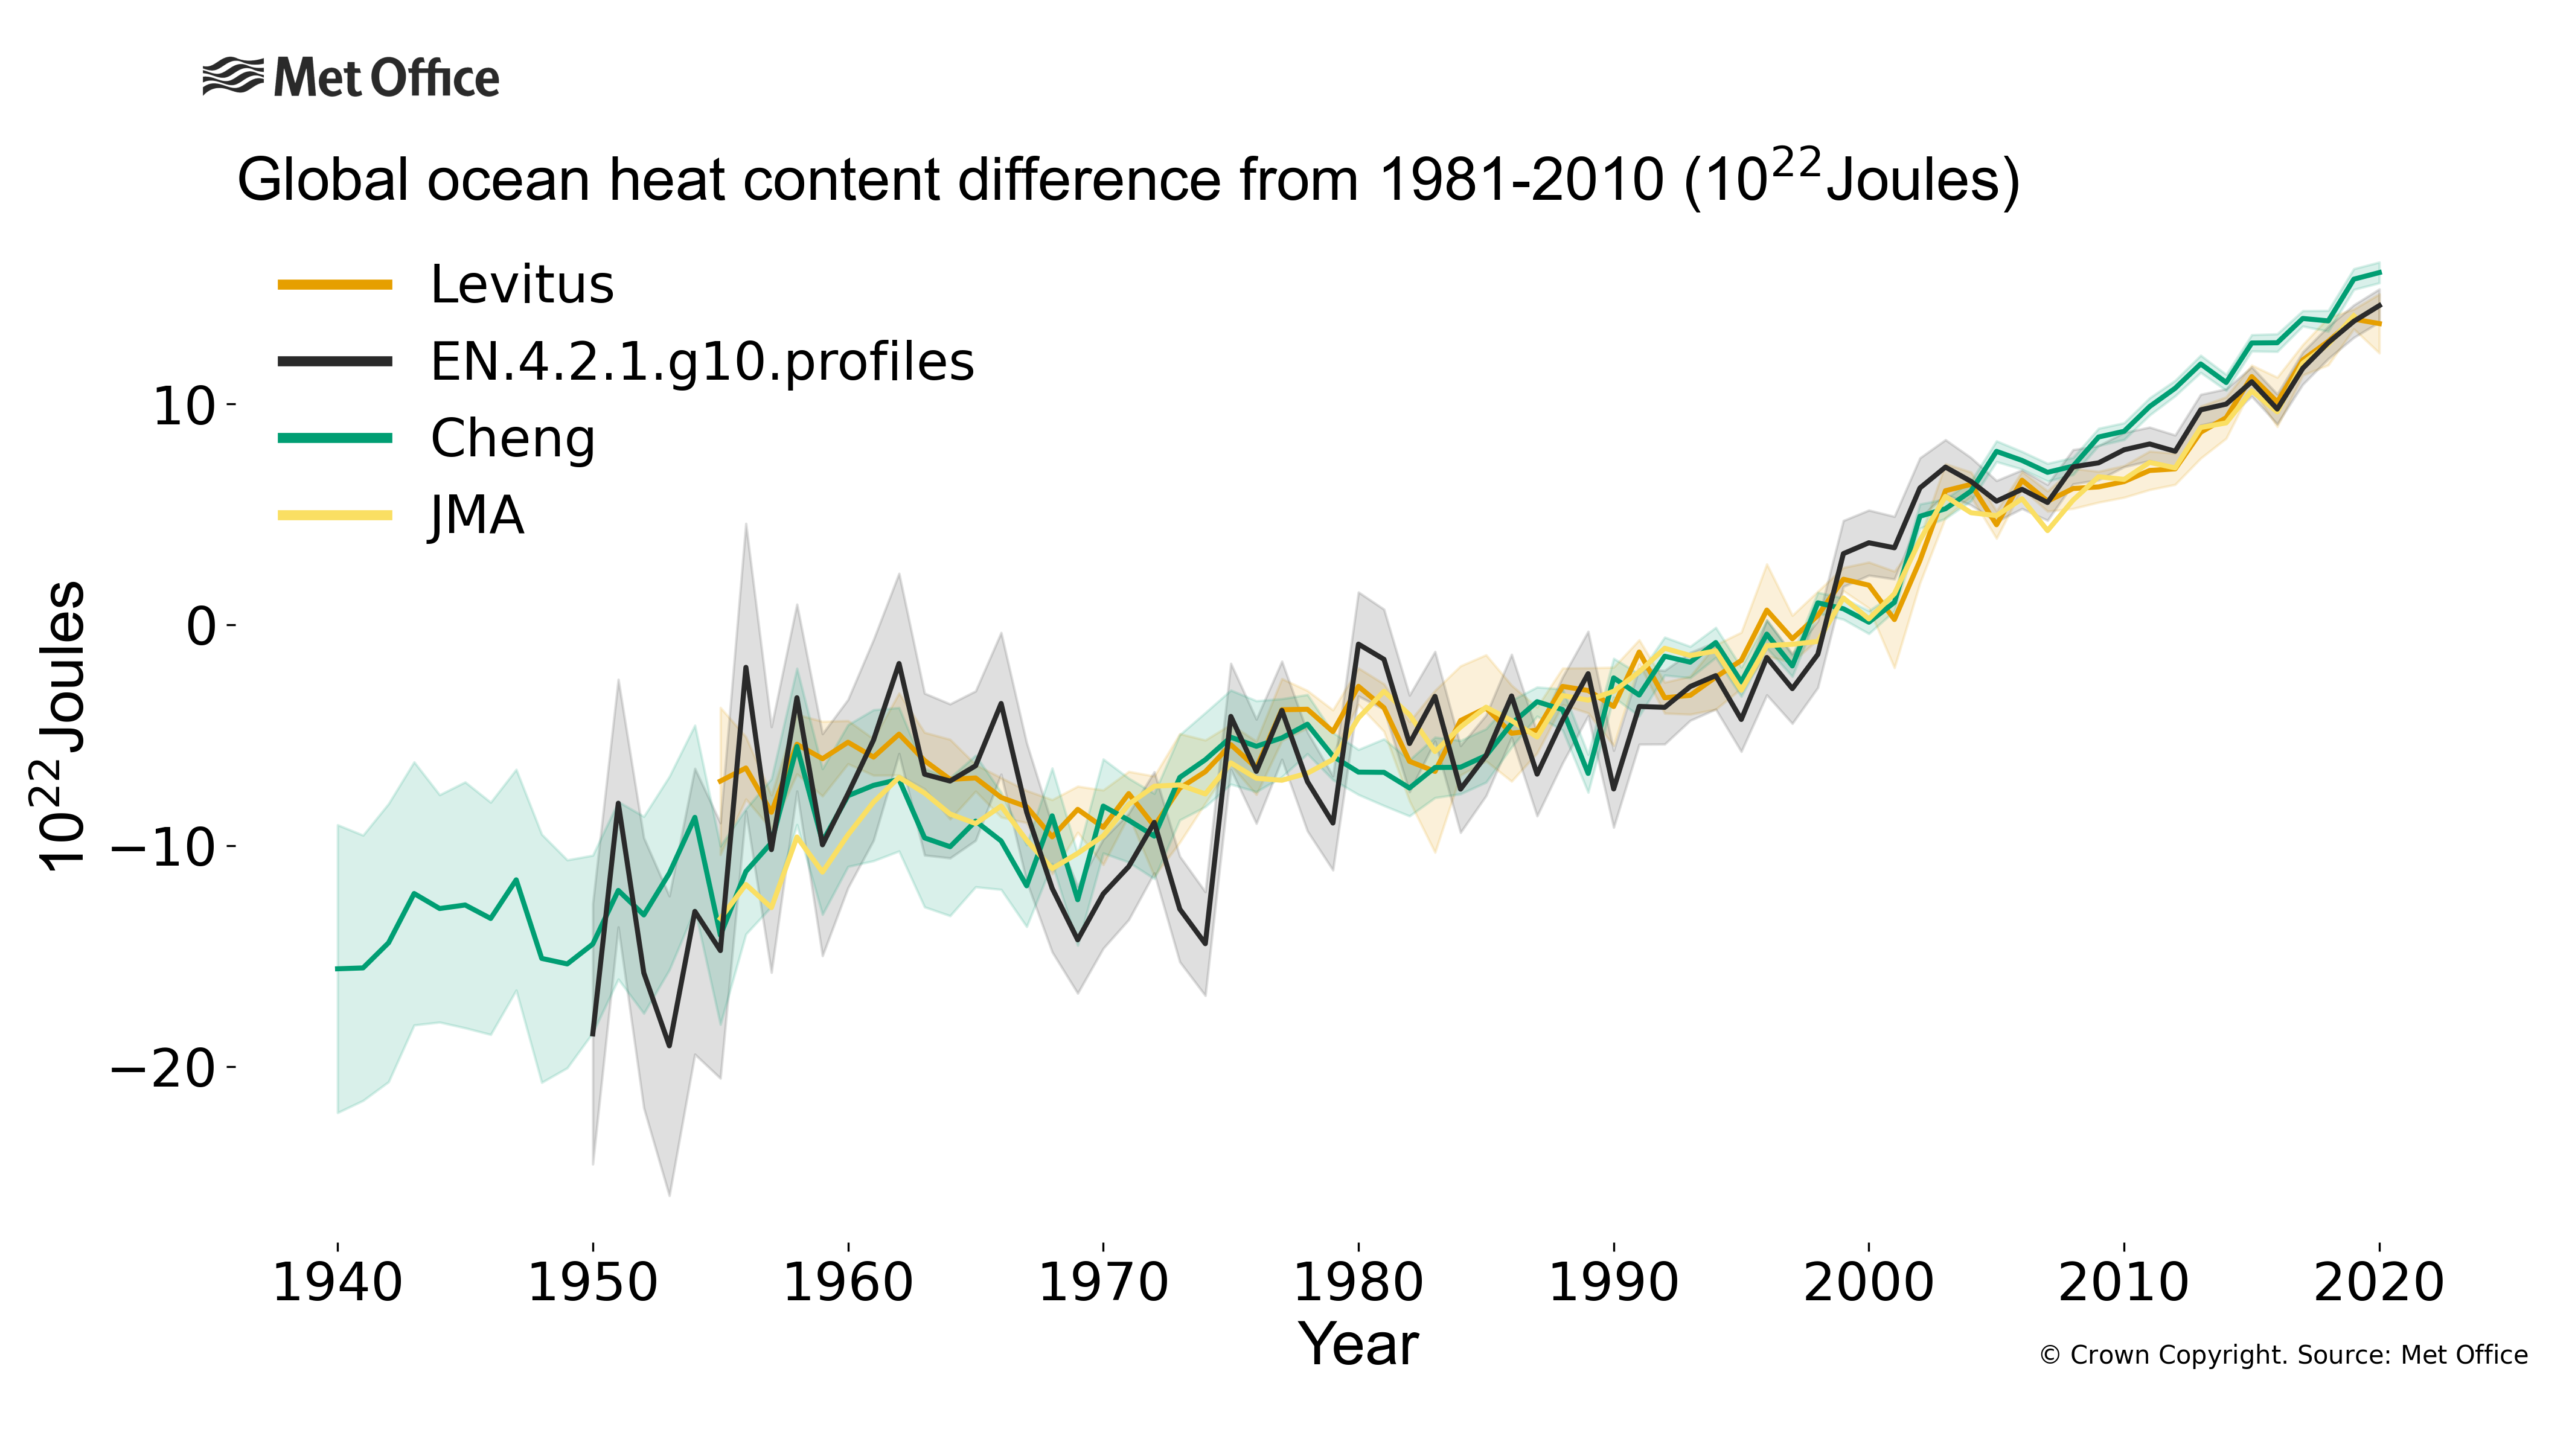
Sea water has a large heat capacity, which means it takes a lot of energy to warm it. However, the oceans are taking up over 90% of the excess energy trapped in the climate system by increased concentrations of greenhouse gases and, as a result, their heat content is increasing. Because oceans are slower to respond to forcing, their heat uptake and resulting thermal expansion are robust measures of climate change as they are less susceptible to the short term climate variability events, such as El Niño, that can cause fluctuations in surface temperature (Allison et al., 2020).
How has thermal expansion affected sea level?
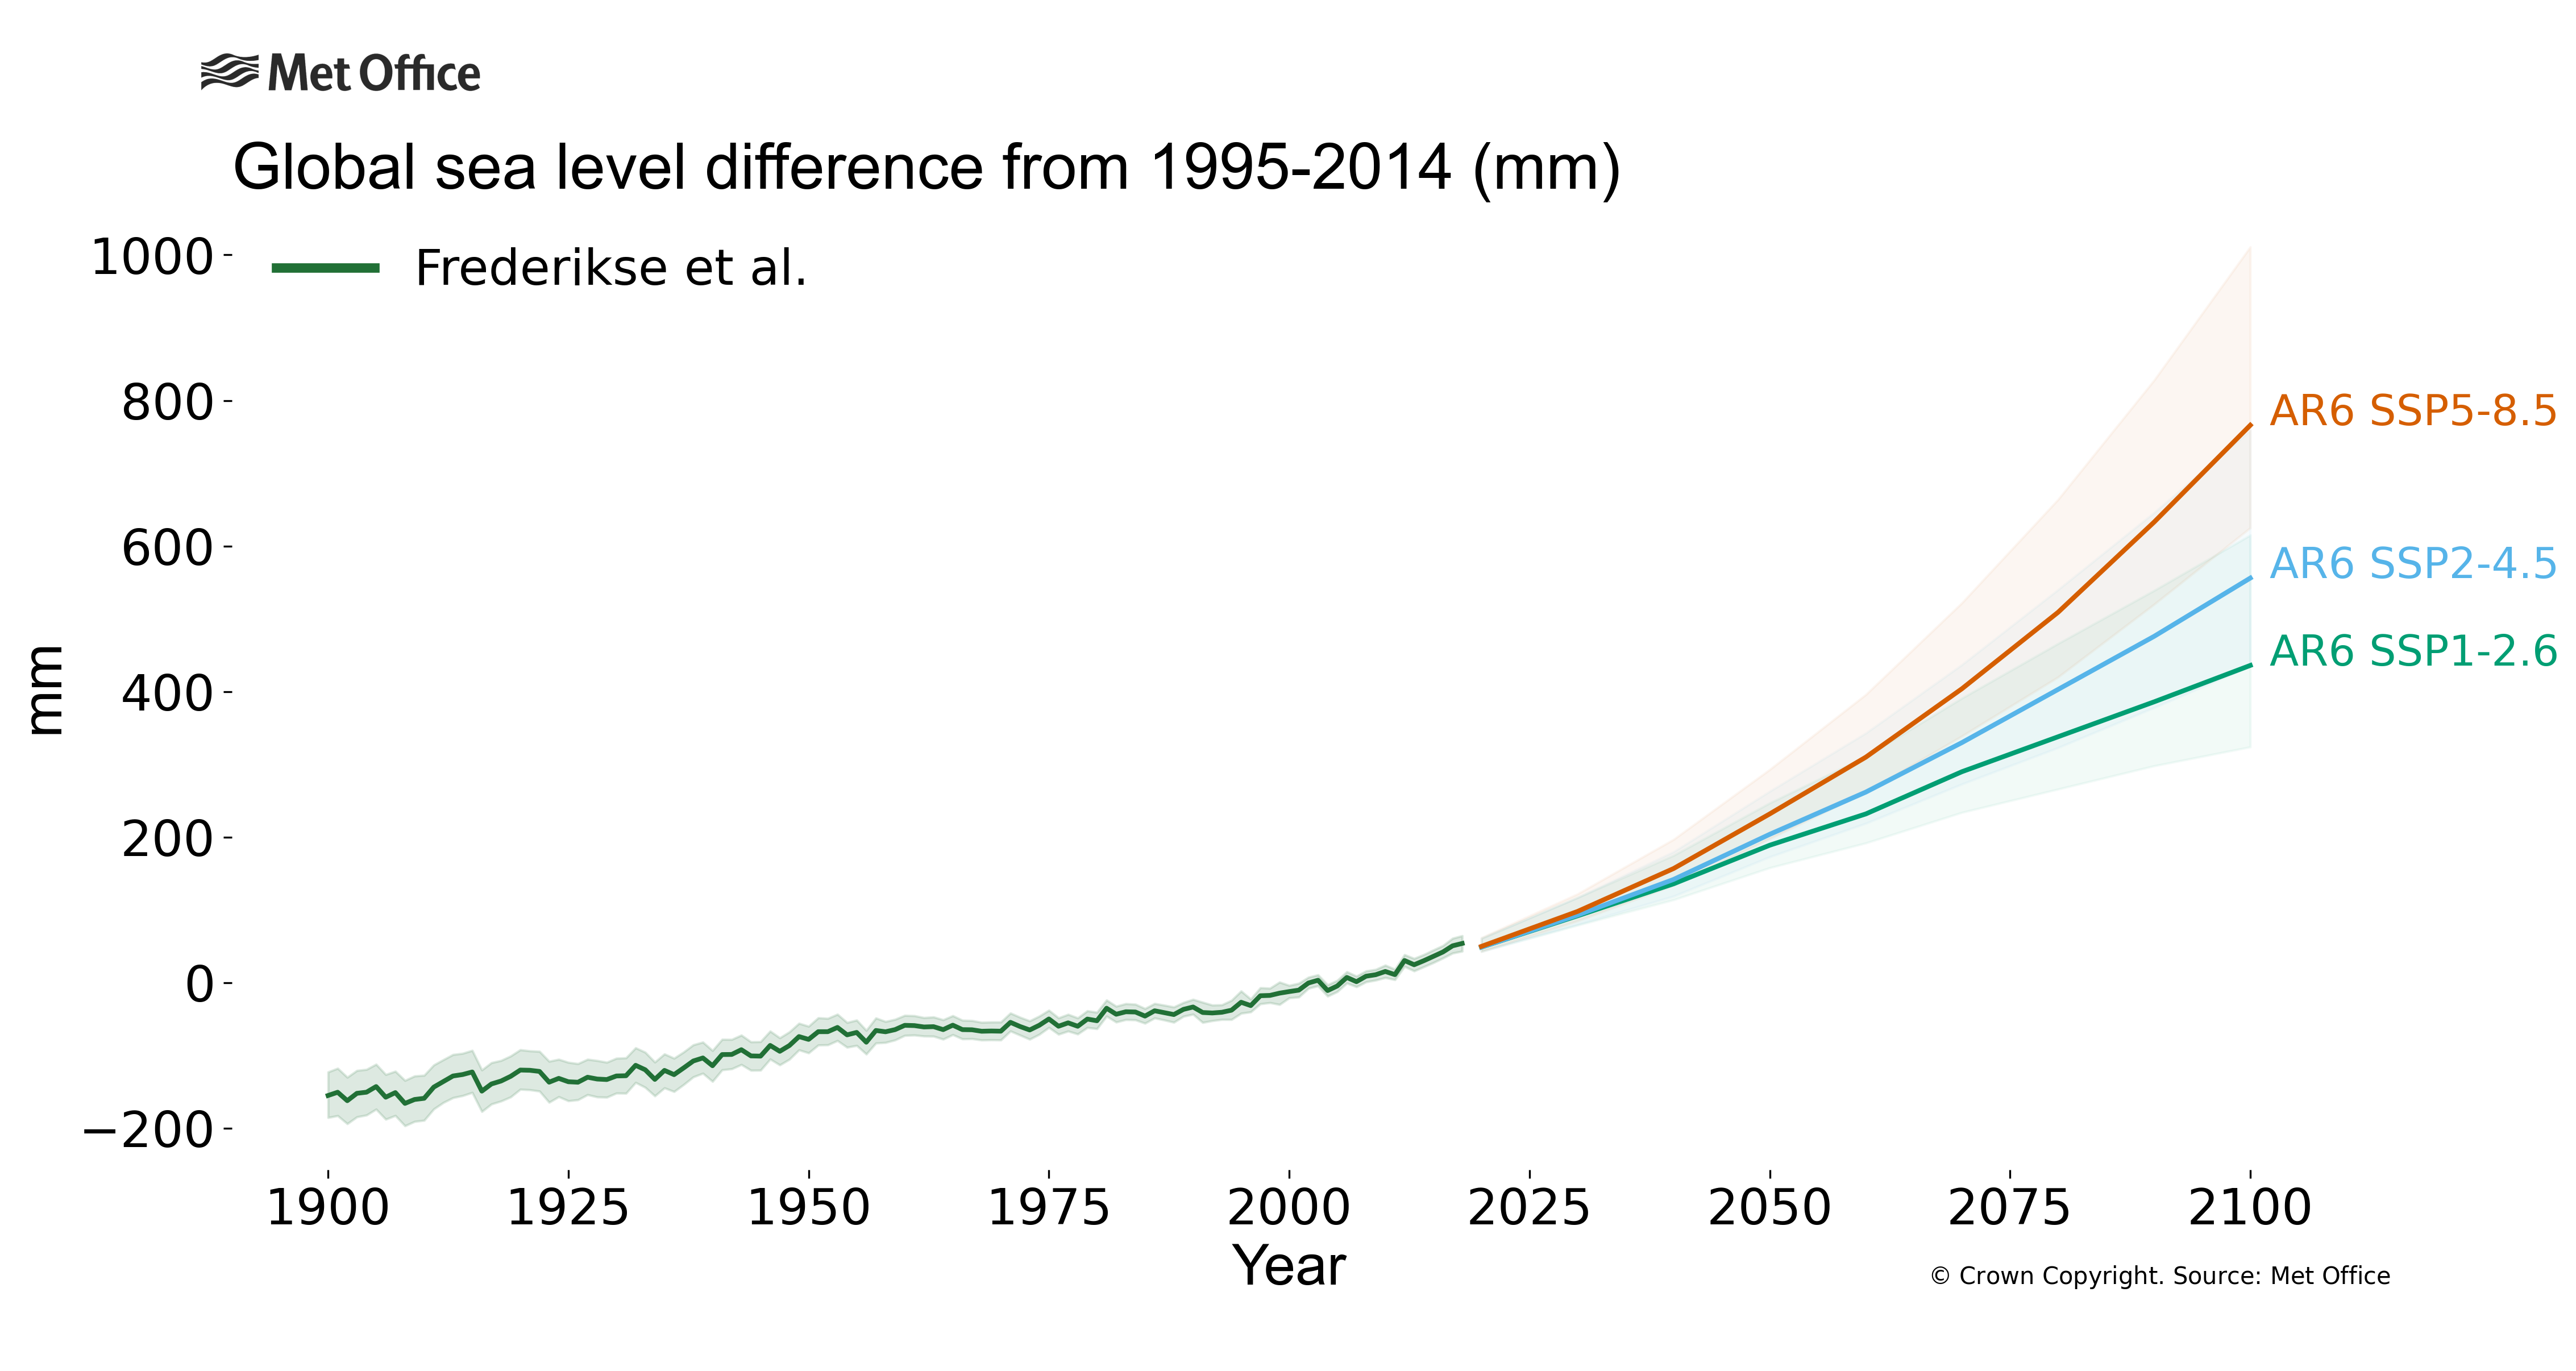
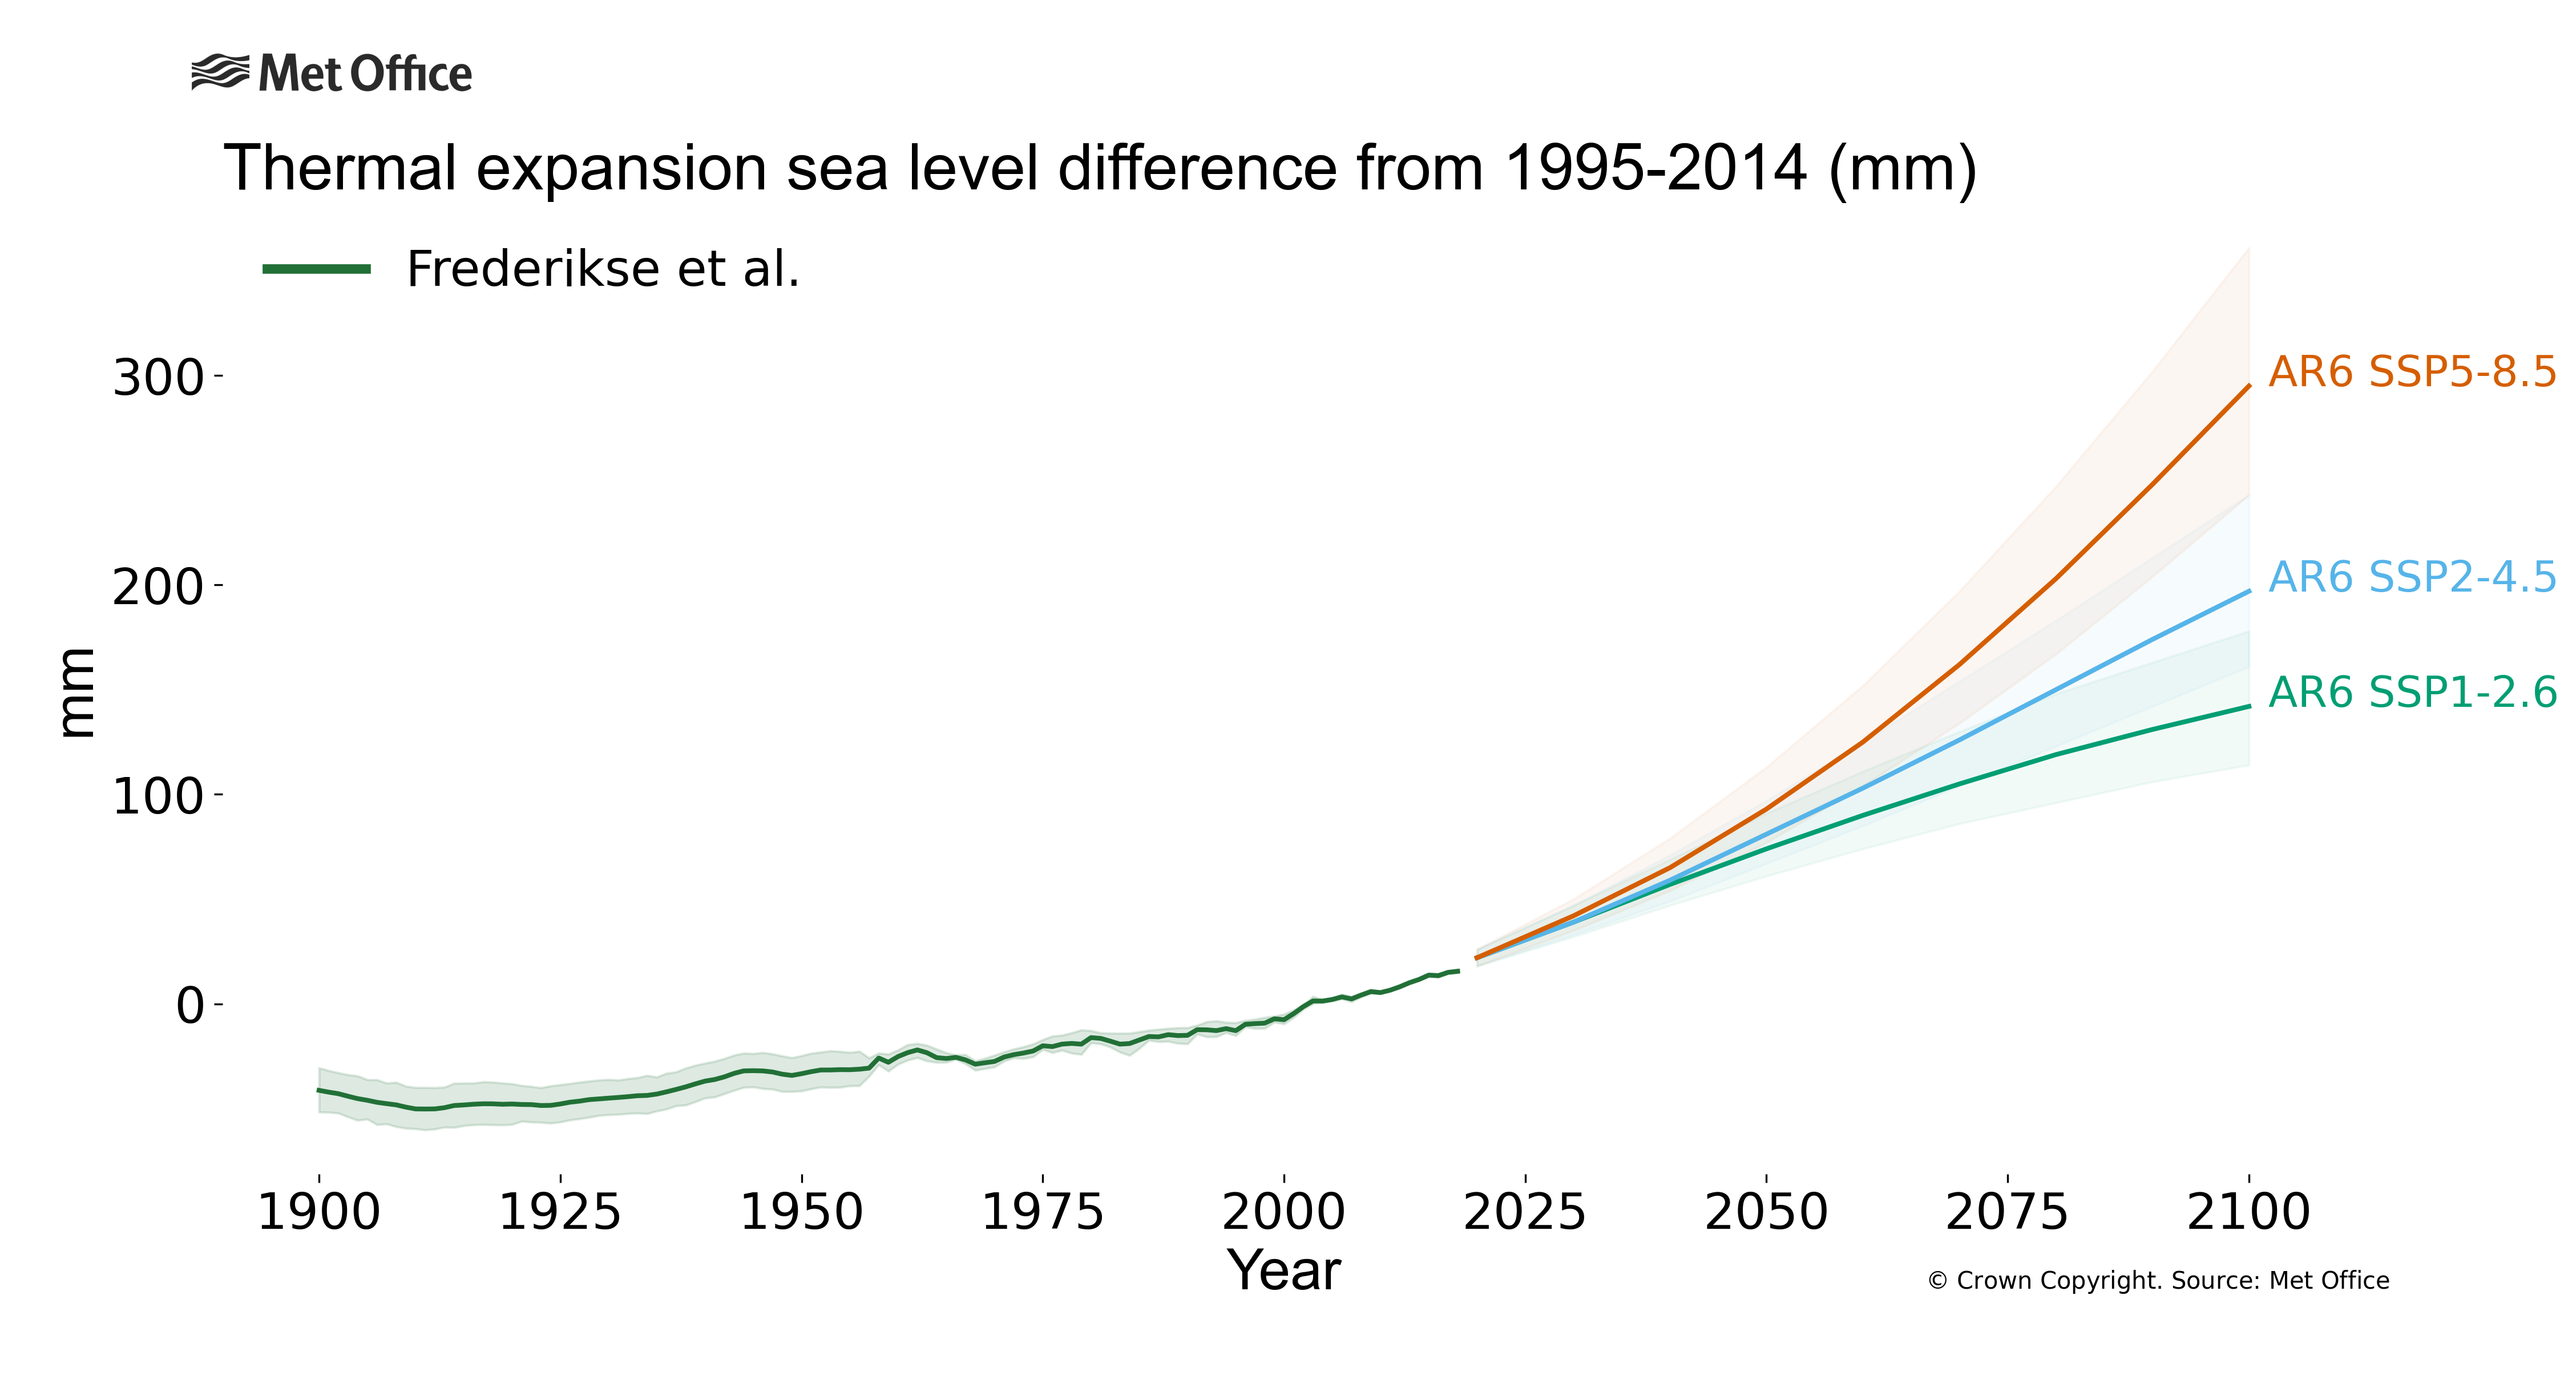
Steric sea level has been increasing on average since at least the 1950s. The increase in heat content, leading to thermal expansion, is not restricted to the relatively well observed upper 700m of the ocean, but is now also evident in the 700-2000m layer and below 2000m. According to IPCC AR6, the contribution to sea level rise from full depth ocean heat uptake has increased from an estimated 0.36mm/yr between 1901 and 1990 to 1.39mm/yr in the period 2006 to 2018.
Why has the thermal expansion component of sea level changed?
The thermosteric component of sea level has increased because of the heat uptake of the ocean in response to greenhouse gas emissions from human activities. IPCC AR6 states: "It is extremely likely that human influence was the main driver of the ocean heat content increase observed since the 1970s, which extends into the deeper ocean (very high confidence)".
How is the thermal expansion component of sea level projected to change in the future?
The oceans are "locked in" to continued warming for a century or more, even under the lowest greenhouse gas emissions scenario. IPCC AR6 states that the amount of ocean heat uptake observed between 1971 and 2018 (396 ZJ) will likely at least double by 2100 under a low warming scenario and will increase by 4 to 8 times under a high warming scenario, with associated sea level rise.
How is the thermal expansion contribution to sea level measured?
Ocean temperatures and salinities have been measured by in situ observing systems, ranging from ship-based bottle and Conductivity Temperature Depth (CTD) observations, to autonomous profiling floats. For more details see the dedicated page on ocean heat content.
Frederikse et al., 2020 calculated the thermosteric contribution to sea level rise from 1957 to 2018 using gridded datasets based on these in situ measurements for the upper 2000m of the ocean. Prior to 1957, the in situ observations were too sparse to use. For the thermosteric contribution before 1957, the approach from Zanna et al. (2019) was used, which uses the principle that all ocean heat anomalies must have been transported from the ocean surface. Ocean heat pathways from the ECCO (Estimating the Circulation of the Climate and the Ocean) model were combined with observed sea-surface temperature anomalies to reconstruct ocean heat content changes and the associated thermosteric expansion.
Below 2000m, measurement coverage has always been sparse, and thus, the approach from Zanna et al. (2019) has been used to estimate this contribution.
How are projections of the thermal expansion component of sea level made?
Projections of thermosteric sea level rise come from a simple climate model "emulator". This is a simplified representation of the climate system that represents the key processes at global scales and provides a consistent set of projections across scenarios. The emulator was constrained by historical observations and estimates of climate sensitivity to provide projections that are consistent with the underlying science assessment of AR6.
Find out more?
References
AR6 Projections
- Information source: Fox-Kemper, B., H. T. Hewitt, C. Xiao, G. Aðalgeirsdóttir, S. S. Drijfhout, T. L. Edwards, N. R. Golledge, M. Hemer, R. E. Kopp, G. Krinner, A. Mix, D. Notz, S. Nowicki, I. S. Nurhati, L. Ruiz, J-B. Sallée, A. B. A. Slangen, Y. Yu, 2021, Ocean, Cryosphere and Sea Level Change. In: Climate Change 2021: The Physical Science Basis. Contribution of Working Group I to the Sixth Assessment Report of the Intergovernmental Panel on Climate Change [Masson-Delmotte, V., P. Zhai, A. Pirani, S. L. Connors, C. Péan, S. Berger, N. Caud, Y. Chen, L. Goldfarb, M. I. Gomis, M. Huang, K. Leitzell, E. Lonnoy, J. B. R. Matthews, T. K. Maycock, T. Waterfield, O. Yelekçi, R. Yu and B. Zhou (eds.)]. Cambridge University Press. In press.
- Information source: Garner, G. G., R. E. Kopp, T. Hermans, A. B. A. Slangen, G. Koubbe, M. Turilli, S. Jha, T. L. Edwards, A. Levermann, S. Nowikci, M. D. Palmer, C. Smith, in prep. Framework for Assessing Changes To Sea-level (FACTS). Geoscientific Model Development.
- Information source: Garner, G. G., T. Hermans, R. E. Kopp, A. B. A. Slangen, T. L. Edwards, A. Levermann, S. Nowikci, M. D. Palmer, C. Smith, B. Fox-Kemper, H. T. Hewitt, C. Xiao, G. Aðalgeirsdóttir, S. S. Drijfhout, T. L. Edwards, N. R. Golledge, M. Hemer, R. E. Kopp, G. Krinner, A. Mix, D. Notz, S. Nowicki, I. S. Nurhati, L. Ruiz, J-B. Sallée, Y. Yu, L. Hua, T. Palmer, B. Pearson, 2021. IPCC AR6 Sea-Level Rise Projections. Version 20210809. PO.DAAC, CA, USA. Dataset accessed [YYYY-MM-DD] at https://podaac.jpl.nasa.gov/announcements/2021-08-09-Sea-level-projections-from-the-IPCC-6th-Assessment-Report.
- Information reference: We thank the projection authors for developing and making the sea-level rise projections available, multiple funding agencies for supporting the development of the projections, and the NASA Sea-Level Change Team for developing and hosting the IPCC AR6 Sea-Level Projection Tool. We also acknowledge the World Climate Research Programme, which, through its Working Group on Coupled Modelling, coordinated and promoted CMIP6. We thank the climate modeling groups for producing and making available their model output, the Earth System Grid Federation (ESGF) for archiving the data and providing access, and the multiple funding agencies who support CMIP6 and ESGF.
Steric Contribution
AR6 SSP1-2.6
AR6 SSP2-4.5
AR6 SSP5-8.5
Frederikse et al.
- Information source: Frederikse, T., Landerer, F., Caron, L. et al. The causes of sea-level rise since 1900. Nature 584, 393–397 (2020). https://doi.org/10.1038/s41586-020-2591-3
- Information reference: Thomas Frederikse, Felix Landerer, Lambert Caron, Surendra Adhikari, David Parkes, Vincent W. Humphrey... Yun-Hao Wu. (2020). data supplement of 'The causes of sea-level rise since 1900' [Data set]. Zenodo. http://doi.org/10.5281/zenodo.3862995


