Why is the Antarctic Ice Sheet important for understanding sea level change?
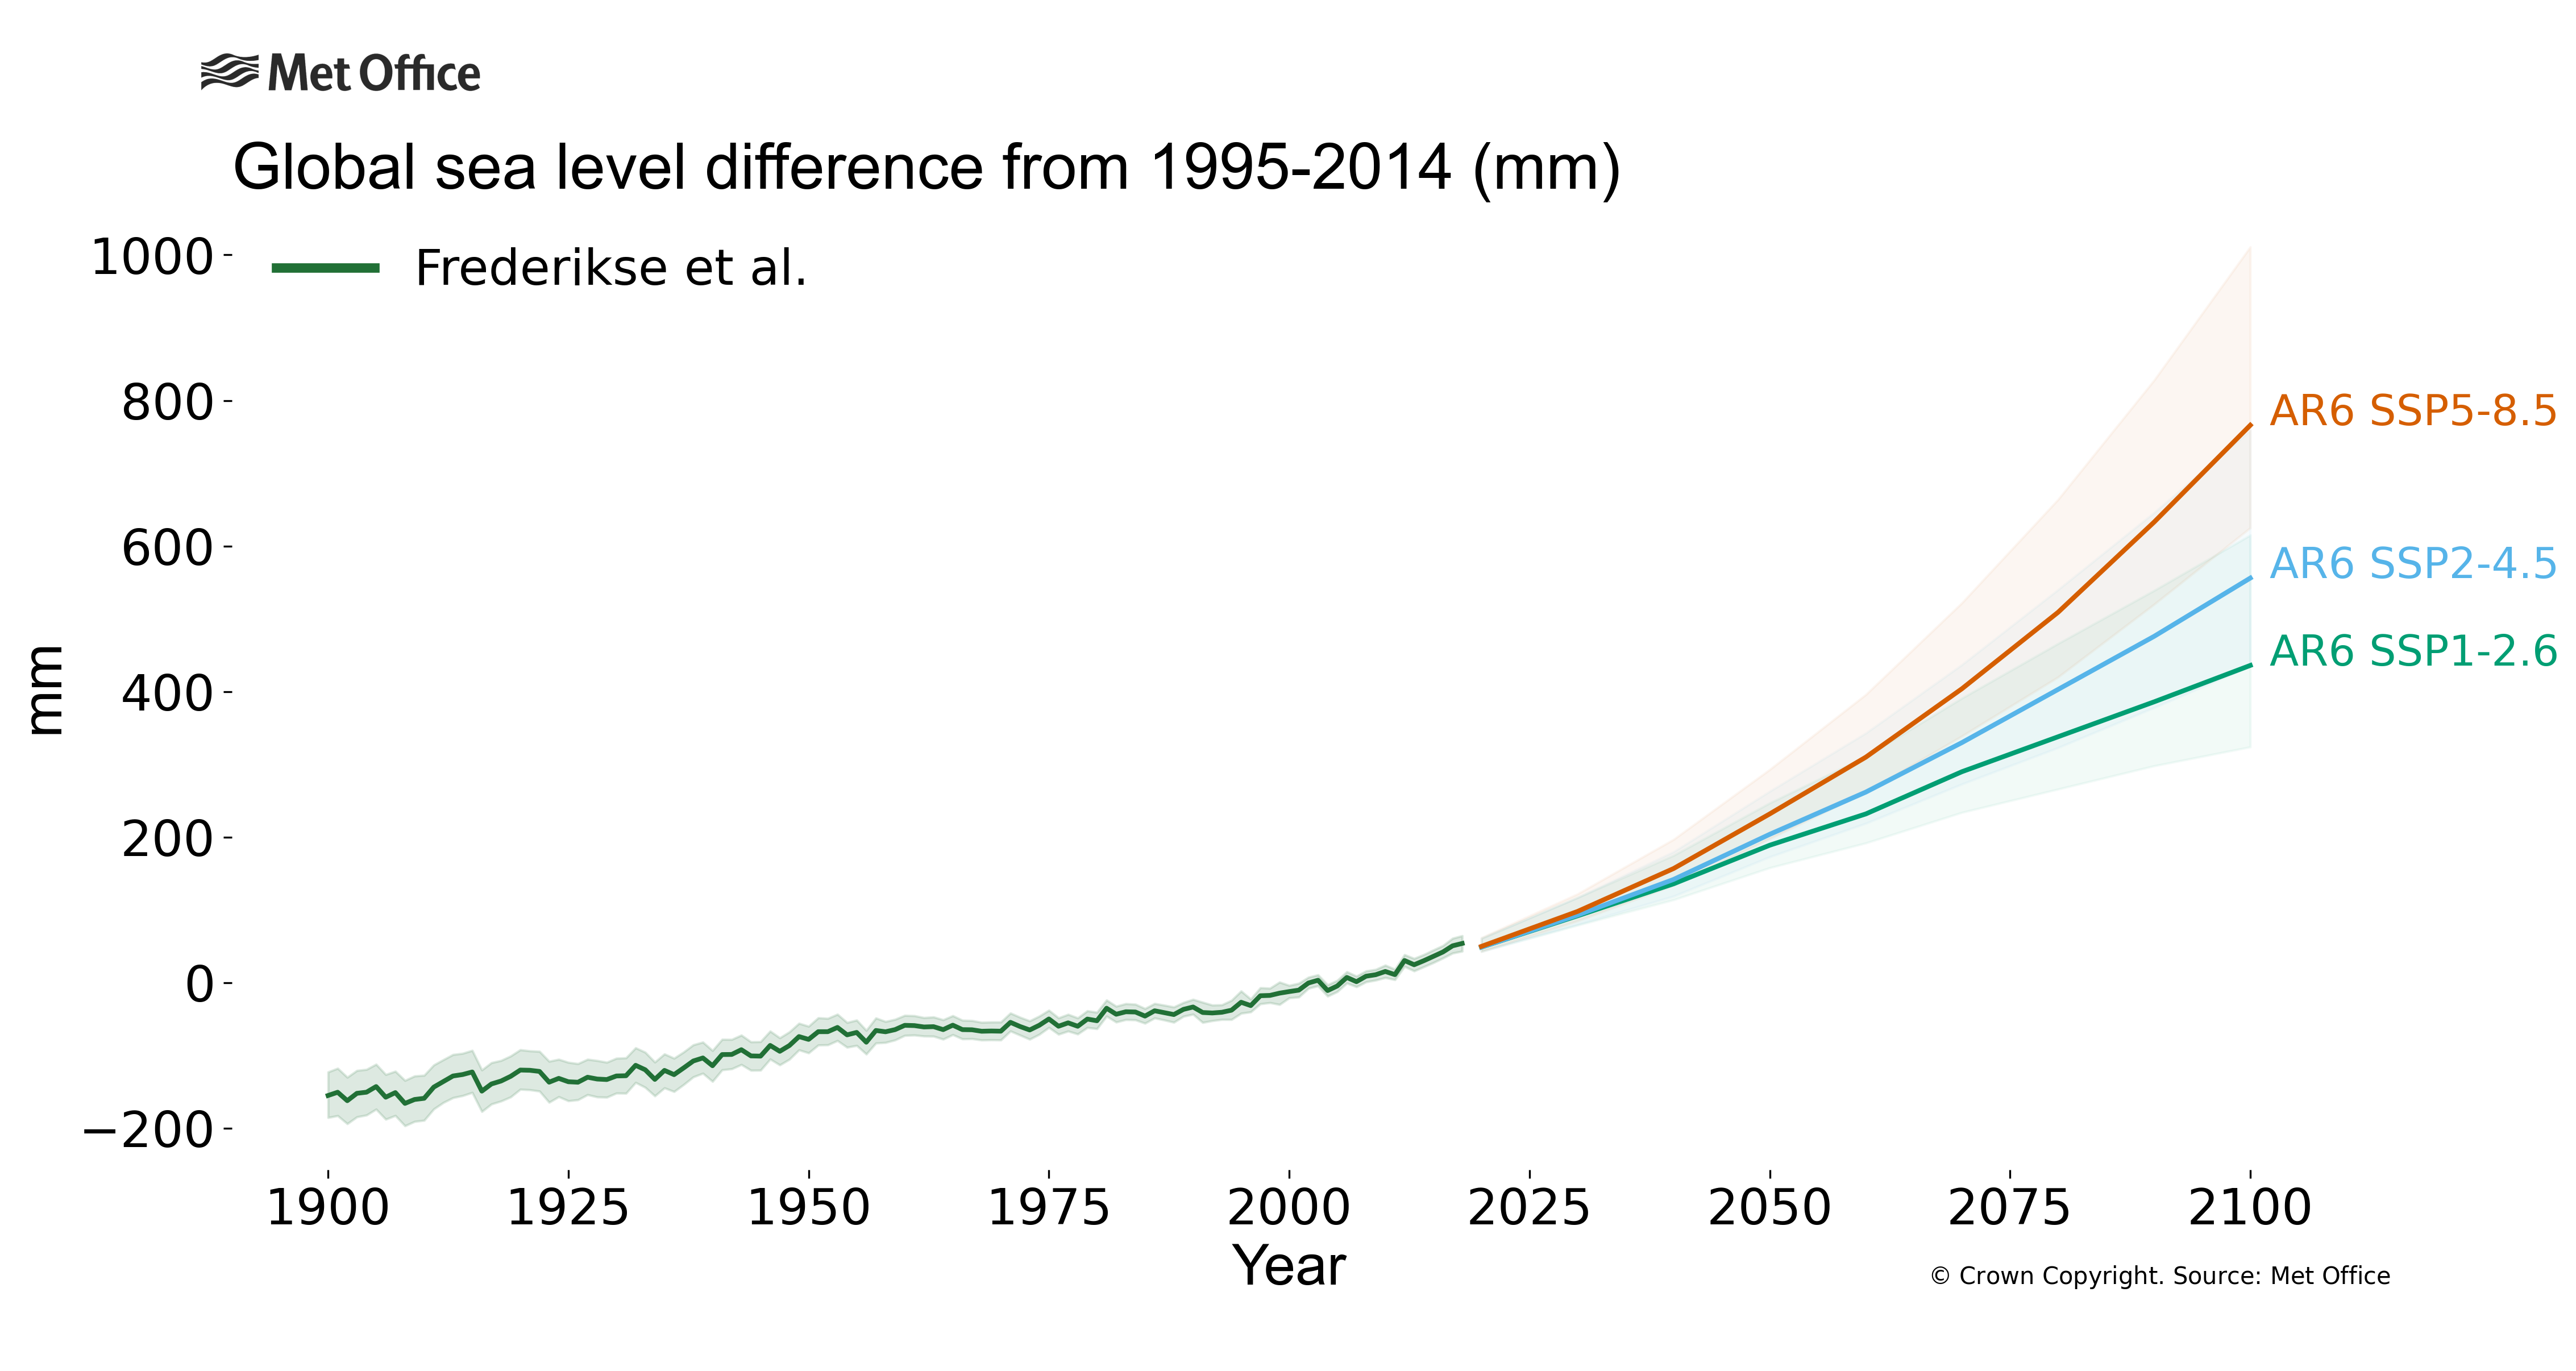
The Antarctic Ice Sheet is the contributor to future sea level rise with the largest uncertainties, but it is also the largest store of frozen freshwater on Earth. Therefore, quantifying past, present and future changes is vital for planning future response to changing sea levels. If there were to be high emissions and no widespread ice sheet disintegration, global mean sea level could rise by just under 7m by 2300. If there were to be high emissions and widespread ice sheet disintegration, global mean sea level could exceed 15m by 2300.
How has the Antarctic Ice Sheet changed?
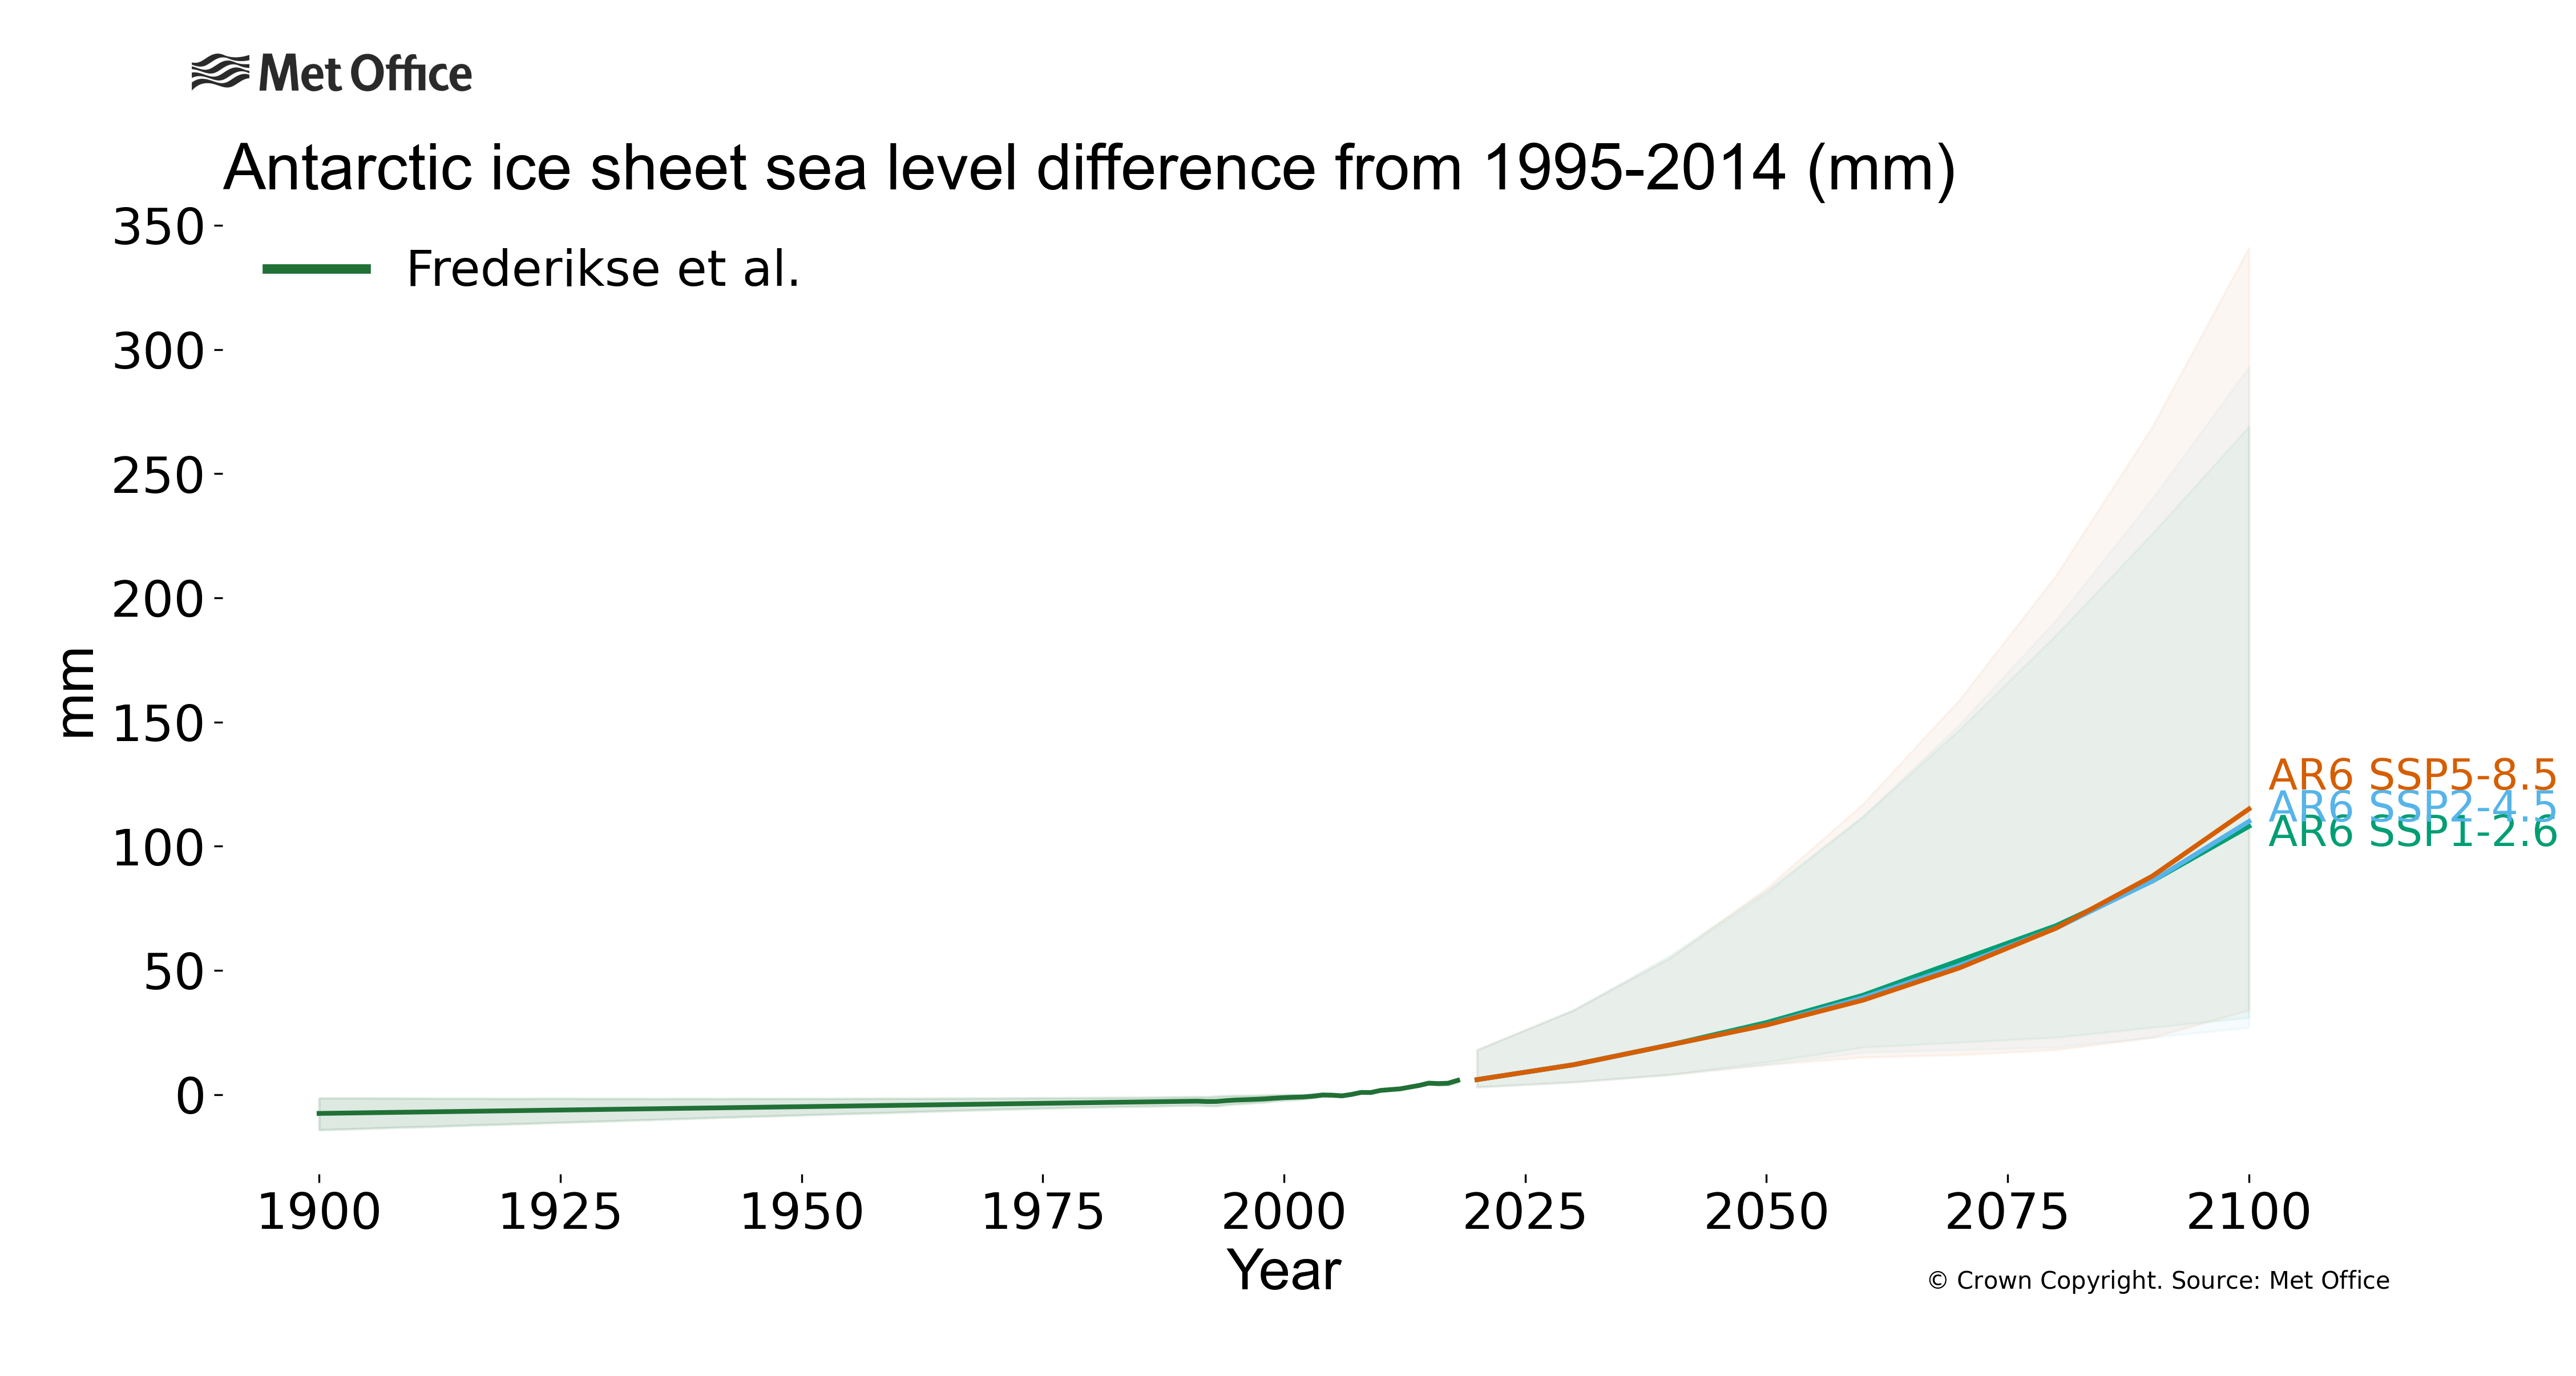
The rate of ice loss from the Antarctic Ice Sheet has increased by approximately a factor of three over the past decades, with an average mass loss rate of 148Gt/yr between 2010 and 2019, compared to 49Gt/yr between 1992 and 1999 according to the IPCC. 362.5Gt of ice is approximately equivalent to 1mm of sea level rise. Prior to 1993, the plotted data assume a small sea level contribution of 0.5mm/yr with an uncertainty of 0.4mm/yr. These values are based on the available observational data which suggest that the Antarctic ice sheet was losing mass over this period.
Why has the Antarctic Ice Sheet changed?
Changes in the mass of the Antarctic Ice Sheet are the result of the balance between accumulation of ice - from snow fall and on the underside of the ice shelves - and loss of ice - from melting, icebergs and sublimation (loss of ice as water vapour). The IPCC states that “there is only limited evidence, with medium agreement, of human influence on the Antarctic Ice Sheet mass loss”.
How is the Antarctic Ice Sheet projected to change in the future?
Sea level rise from Antarctic ice sheet mass loss over the coming century is likely, but there is a greater amount of uncertainty in Antarctic Ice Sheet processes than in other contributors to sea level rise. This is reflected in the wider shaded range that can be seen in this projection’s plot relative to the other components (note the y-axis range varies between plots to maximise the details visible in the observed time series as well as the projections). Under low emissions scenarios the uncertainties have little effect on the projected values at 2100, but under high emissions scenarios these uncertain ice processes, lead to a range of possible sea level contributions from 0.5m to 2.3m. This uncertainty stems from the possibility of sudden and/or irreversible loss of parts of the ice sheet, which could lead to a collapse of the West Antarctic Ice Sheet.
It is possible that increased snow-fall over Antarctica, associated with a warmer atmosphere transporting more moisture poleward, will cause an increase of ice mass and associated global sea level fall. However, the possibility of rapid and irreversible ice sheet losses, associated with dynamic ice sheet processes, cannot be ruled out, and these have the potential to contribute to a global mean sea level rise in excess of 15m by 2300 under a very high greenhouse gas emissions scenario.
How are measurements of the Antarctic Ice Sheet made?
Frederikse et al., 2020 make use of two multi-method assessments to determine the ice loss from 1993 to 2003. These are the IMBIE assessment ( IMBIE, 2018) which compares 24 different ice sheet mass balance change estimates for Antarctica and the Bamber et al., 2018 assessment which compares estimates based primarily on literature published since AR5 (2013) along with expert judgement, new analyses, and statistical models. After 2003, the Frederikse et al., 2020 data come from observations from the GRACE satellite missions, which observe redistribution of mass over the Earth’s surface by measuring changes in the Earth gravity field. Other satellite observations which track changes in ice sheets are available from CPOM and these also track changes in sea ice.
Before 1993, a small but steady sea level contribution of 0.05mm/yr (with an uncertainty of 0.4mm/yr) is used, based on observational evidence in certain Antarctic regions ( Cook et al., 2005; Smith et al., 2017) that suggests the Antarctic Ice Sheet mass was declining over this time period.
How are Antarctic Ice Sheet projections made?
Simulations of the Antarctic Ice Sheet from the ISMIP6 and LARMIP-2 ice sheet multi-model intercomparison projects were used as inputs to simple models known as "emulators" to provide a set of projections across scenarios that are consistent with the underlying science assessment of AR6. The projections based on ISMIP6 and LARMIP-2 are then combined to provide estimates of the likely ranges of sea level contribution that incorporate the uncertainties from both. This is done using a ‘p-box’ approach, which uses the mean of the projection medians as the overall median ice sheet contribution, and the outer limits of their likely ranges as the combined likely range – i.e. the lower of the two 17th percentiles and the higher of the two 83rd percentiles of the distributions. Beyond 2100, the projections are extended using emulators based on either a constant rate of mass loss or the AR6 assessment at 2300. A 'p-box' of two high-end estimates, from structured expert judgement and model projections of instability due to ice cliffs collapsing, was also used as an estimate of the "low likelihood, high impact" possibility of rapid mass loss.
Find out more?
References
AR6 Projections
- Information source: Fox-Kemper, B., H. T. Hewitt, C. Xiao, G. Aðalgeirsdóttir, S. S. Drijfhout, T. L. Edwards, N. R. Golledge, M. Hemer, R. E. Kopp, G. Krinner, A. Mix, D. Notz, S. Nowicki, I. S. Nurhati, L. Ruiz, J-B. Sallée, A. B. A. Slangen, Y. Yu, 2021, Ocean, Cryosphere and Sea Level Change. In: Climate Change 2021: The Physical Science Basis. Contribution of Working Group I to the Sixth Assessment Report of the Intergovernmental Panel on Climate Change [Masson-Delmotte, V., P. Zhai, A. Pirani, S. L. Connors, C. Péan, S. Berger, N. Caud, Y. Chen, L. Goldfarb, M. I. Gomis, M. Huang, K. Leitzell, E. Lonnoy, J. B. R. Matthews, T. K. Maycock, T. Waterfield, O. Yelekçi, R. Yu and B. Zhou (eds.)]. Cambridge University Press. In press.
- Information source: Garner, G. G., R. E. Kopp, T. Hermans, A. B. A. Slangen, G. Koubbe, M. Turilli, S. Jha, T. L. Edwards, A. Levermann, S. Nowikci, M. D. Palmer, C. Smith, in prep. Framework for Assessing Changes To Sea-level (FACTS). Geoscientific Model Development.
- Information source: Garner, G. G., T. Hermans, R. E. Kopp, A. B. A. Slangen, T. L. Edwards, A. Levermann, S. Nowikci, M. D. Palmer, C. Smith, B. Fox-Kemper, H. T. Hewitt, C. Xiao, G. Aðalgeirsdóttir, S. S. Drijfhout, T. L. Edwards, N. R. Golledge, M. Hemer, R. E. Kopp, G. Krinner, A. Mix, D. Notz, S. Nowicki, I. S. Nurhati, L. Ruiz, J-B. Sallée, Y. Yu, L. Hua, T. Palmer, B. Pearson, 2021. IPCC AR6 Sea-Level Rise Projections. Version 20210809. PO.DAAC, CA, USA. Dataset accessed [YYYY-MM-DD] at https://podaac.jpl.nasa.gov/announcements/2021-08-09-Sea-level-projections-from-the-IPCC-6th-Assessment-Report.
- Information reference: We thank the projection authors for developing and making the sea-level rise projections available, multiple funding agencies for supporting the development of the projections, and the NASA Sea-Level Change Team for developing and hosting the IPCC AR6 Sea-Level Projection Tool. We also acknowledge the World Climate Research Programme, which, through its Working Group on Coupled Modelling, coordinated and promoted CMIP6. We thank the climate modeling groups for producing and making available their model output, the Earth System Grid Federation (ESGF) for archiving the data and providing access, and the multiple funding agencies who support CMIP6 and ESGF.
Antarctic Contribution
AR6 SSP1-2.6
AR6 SSP2-4.5
AR6 SSP5-8.5
Frederikse et al.
- Information source: Frederikse, T., Landerer, F., Caron, L. et al. The causes of sea-level rise since 1900. Nature 584, 393–397 (2020). https://doi.org/10.1038/s41586-020-2591-3
- Information reference: Thomas Frederikse, Felix Landerer, Lambert Caron, Surendra Adhikari, David Parkes, Vincent W. Humphrey... Yun-Hao Wu. (2020). data supplement of 'The causes of sea-level rise since 1900' [Data set]. Zenodo. http://doi.org/10.5281/zenodo.3862995


