Why is sea level important?
Changes in mean sea level can affect coastal areas in a variety of ways. Changes in sea levels modify coastal flood risk. Increases in local sea level can exacerbate inundation associated with high-tides and storms, including hurricanes and typhoons. Rising sea level can also change the erosion rate in coastal areas and the intrusion of salt water. More details on the impacts of sea level rise can be found in the IPCC Special Report on Global warming of 1.5°C.
Sea level is also scientifically important as it reflects changes in the mass of water the oceans contain and their temperature (sea water, like most other things, expands when heated). There are separate ways of measuring the mass and temperatures of the oceans, and by comparing them it is possible to check that the different components "add up" increasing confidence in our understanding of the processes involved. We now have sea-level "budgets", as they are known, back to 1900. The sum of the individual components in these budgets agrees with our independent measurement of total sea level rise to within the estimated uncertainties and this gives us confidence that we understand the underlying processes and can quantify them.
How has sea level changed?
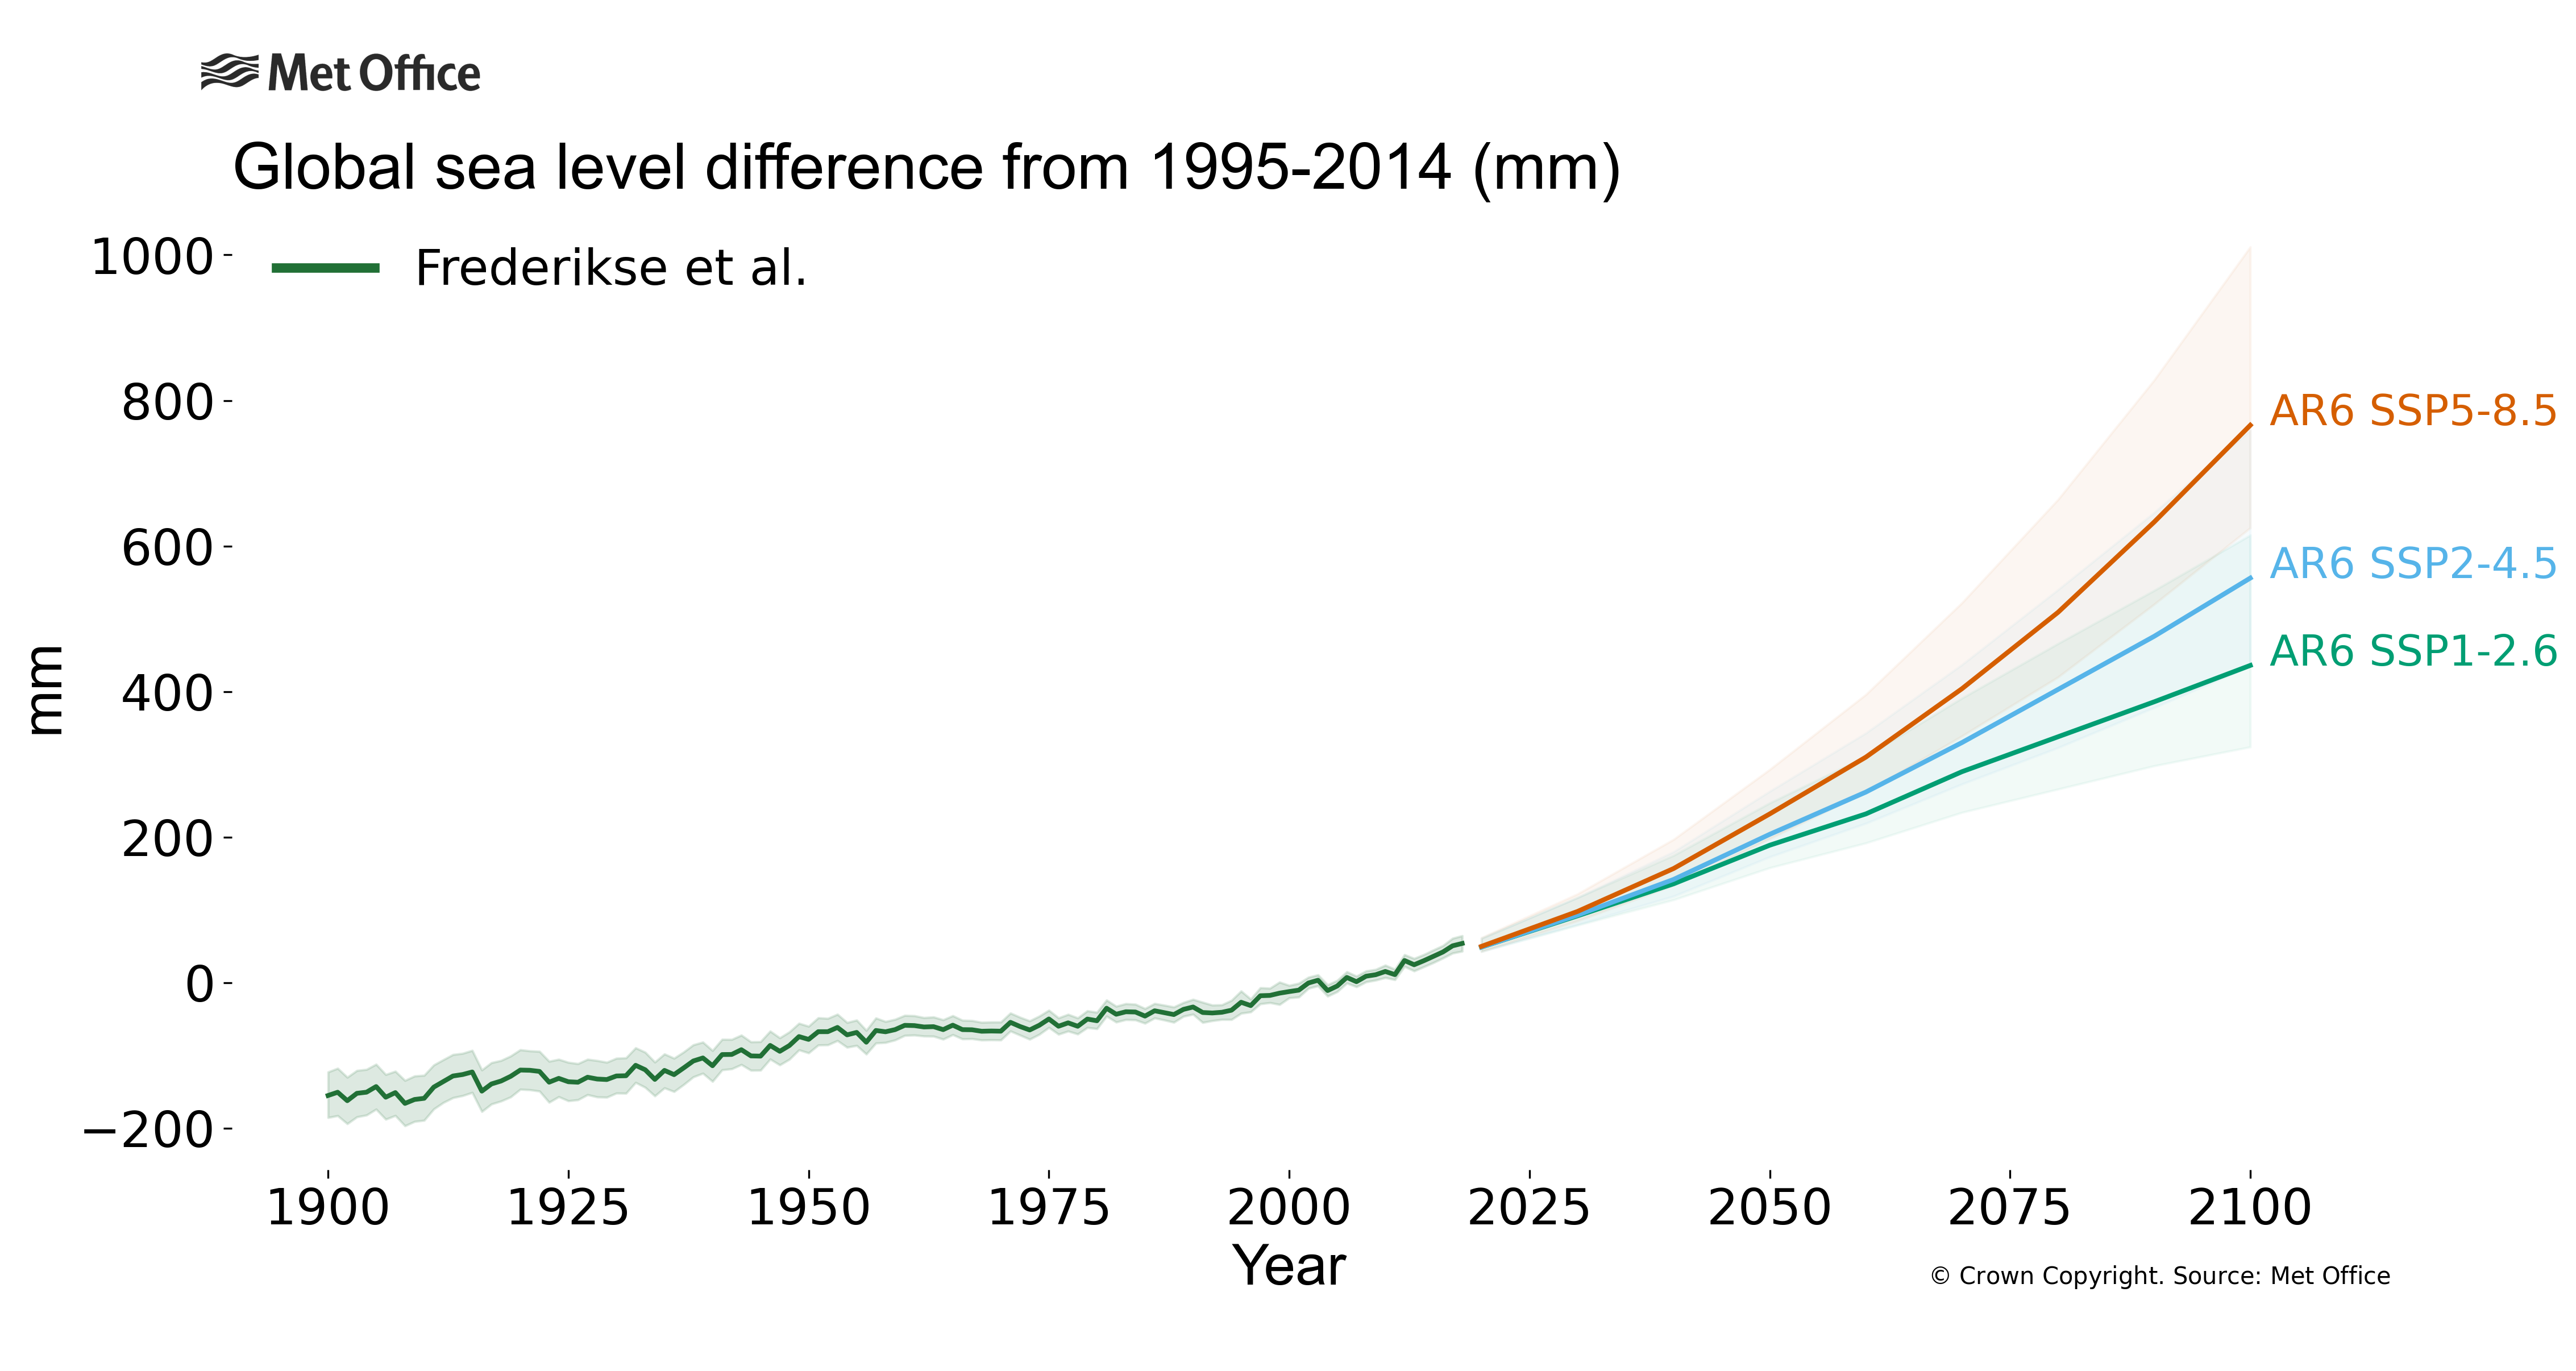
Global mean sea level has been increasing since long-term tide gauge records began in the late 19th century. The most recent IPCC assessment report, IPCC AR6, states that global mean sea level has risen by 200mm between 1901 and 2018. This report also shows evidence that the rise has accelerated since the late 1960s, increasing from 2.3mm/yr between 1971 and 2018 to 3.7mm/yr between 2006 and 2018. Between 1901 and 1971 the rate was only 1.3mm/yr. Since 2006, all contributors to sea level change – thermal expansion, land water storage, and ice loss from glaciers and the Greenland and Antarctic Ice sheets - have shown their largest rate of increase.
Sea level has not risen uniformly everywhere, however. Some areas have seen more rapid sea-level rise, others a slower rise or decline. Local variations can be caused by a variety of things such as local variations in water temperature, or large-scale climate modes, such as El Niño. The height of the land can change too, complicating the picture if measurements are made relative to a fixed point on land. Some land areas are rising or falling as they slowly adjust to the loss of ice caps and glaciers from the last ice age. Other areas are changing for human-caused reasons, such as extraction of groundwater.
Why has sea level changed?
Since 1971, the dominant cause of sea-level change has been human-caused climate change. Over this period all contributors to sea level were positive: 50% of the sea level rise between 1971 and 2018 came from the thermal expansion of the oceans, 22% from glaciers, 20% from ice sheets and 8% from changes in land water storage. Ice sheet loss has increased substantially in the last few decades, and the combined ice loss from ice sheets and glaciers, was the largest contribution to global mean sea level rise between 2006 and 2018.
How is sea level projected to change in the future?
The future course of the climate is unknown, but scientists use ‘scenarios’, which are plausible options to inform what could happen if different decisions are made. For example, a high-end scenario (AR6 SSP5-8.5) assumes high greenhouse gas (GHG) emissions, whereas a low-end scenario (AR6 SSP1-1.9) assumes low GHG emissions and net zero CO2 emissions by 2050, with more CO2 being taken out of the atmosphere than added to it after this point (net negative CO2 emissions).
Although the amount of projected sea level change depends on the scenario, estimates based on all scenarios agree that global mean sea level will continue to rise during the 21st century and for many centuries thereafter. The oceans and cryosphere respond to climate change more slowly than atmospheric temperatures, with deep ocean heat uptake and mass loss from the ice sheets projected to continue for centuries to millennia. Due to large uncertainty in the response of ice sheets to warming, it is not possible to rule out an additional metre of sea-level rise by 2100, and several meters by 2150, under a high greenhouse gas emissions scenario.
During this century, most tide gauge locations will see sea levels rise by a similar amount to the global mean. However, by 2100, at over half the global tide gauge locations, this increase in the mean could see extreme sea levels that currently happen in less than 1% of years under the most extreme conditions, happening once per year on average.
How is sea level measured?
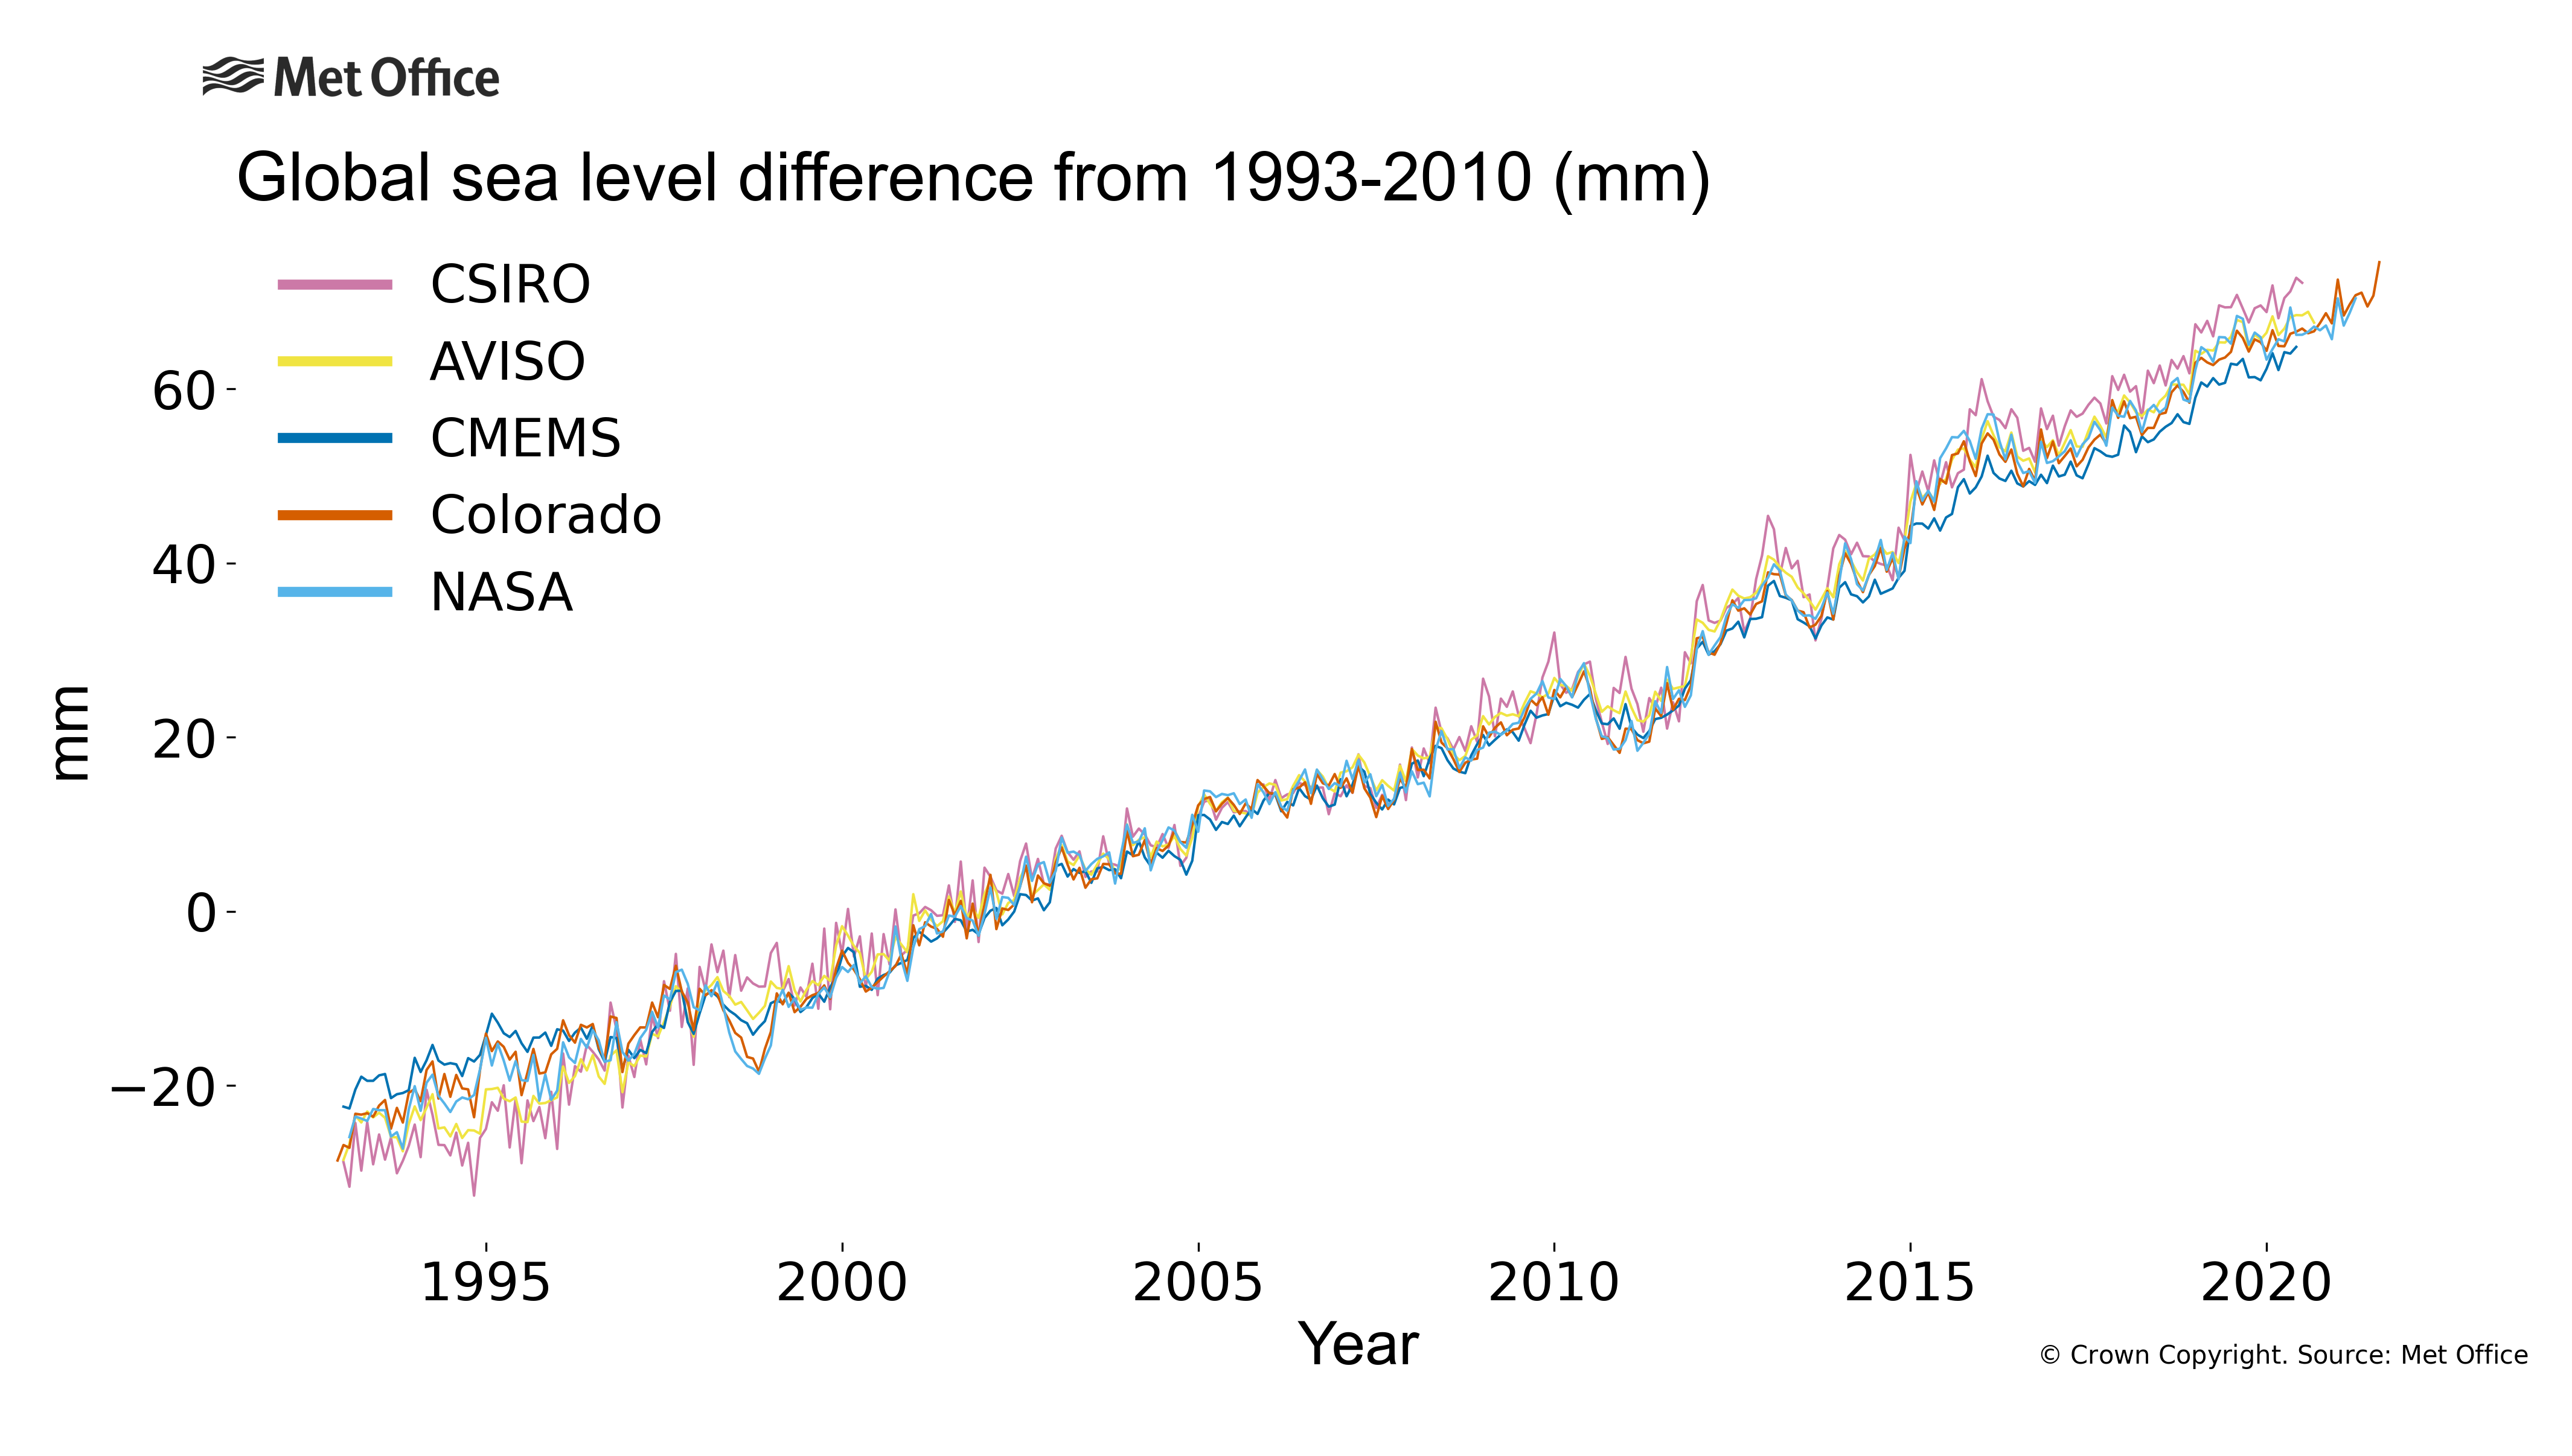
Since 1993, satellites can accurately measure global and regional sea-level changes. Satellite measurements are made using a radar system that bounces radio waves off the sea surface and works out the distance between the satellite and the surface from the time it takes for the waves to make it from the satellite to the surface and back again. To make an accurate satellite measurement, a number of things need to be considered. First, we need to know the height of the satellite. This can be done using GPS and ground-based laser systems. Second, the speed of the radio waves through the air depends on how much water vapour there is in the air and on the state of the ionosphere (part of Earth’s upper atmosphere). The amount of water vapour can be measured by the satellite and the degree of the slowdown in the ionosphere is estimated by comparing reflections at two different frequencies. Other things that need to be accounted for include the removal of predictable ocean tides and the effect of short-lived weather systems on sea level; low-pressure systems like storms and hurricanes can "suck" the sea-surface up a little.
Before 1993, we rely on observations from tide gauges. In Frederikse et al. (2020), 559 tide-gauge records have been used to determine global-mean sea-level rise since 1900. Most of these records come from the Permanent Service for Mean Sea Level (PSMSL), but due to data rescue efforts, more and more old records have been digitized over the past few years, which is of great help in filling in the gaps in the observation network (e.g. Hogarth, 2014, Le Cozzanet et al. 2015). Since sea level varies from place to place, and tide gauges are not evenly spread over the oceans, these records must be corrected for local effects before estimating the global-mean sea-level curve. The largest effect is glacial isostatic adjustment: the ongoing deformation of the whole Earth as a result of the heavy ice sheets that covered large parts of the land during the last glacial period. The Earth is still recovering from the deformation of the land below the former ice sheets, which causes vertical motion of the land, which in turn affect the tide-gauge observations. An ensemble of GIA estimates from Caron et al. (2018), together with GPS observations (Blewitt et al. 2018) and satellite altimetry (Kleinherenbrink et al. 2018) has been used to correct tide-gauge records for these local land motions before merging them into a global-mean curve.
How are sea level projections made?
A combination of models that represent the different components of sea level change are used to provide projections of these components and their total. Overviews of the models used for each component in the IPCC AR6 projections are provided on the component information pages [thermal expansion, glaciers, Greenland ice sheet, Antarctic ice sheet and land water storage]. The projections from the individual components are designed to be consistent with other elements of the climate projections, such as the global surface air temperature, the equilibrium climate sensitivity and the transient climate response .
Find out more?
References
AR6 Projections
- Information source: Fox-Kemper, B., H. T. Hewitt, C. Xiao, G. Aðalgeirsdóttir, S. S. Drijfhout, T. L. Edwards, N. R. Golledge, M. Hemer, R. E. Kopp, G. Krinner, A. Mix, D. Notz, S. Nowicki, I. S. Nurhati, L. Ruiz, J-B. Sallée, A. B. A. Slangen, Y. Yu, 2021, Ocean, Cryosphere and Sea Level Change. In: Climate Change 2021: The Physical Science Basis. Contribution of Working Group I to the Sixth Assessment Report of the Intergovernmental Panel on Climate Change [Masson-Delmotte, V., P. Zhai, A. Pirani, S. L. Connors, C. Péan, S. Berger, N. Caud, Y. Chen, L. Goldfarb, M. I. Gomis, M. Huang, K. Leitzell, E. Lonnoy, J. B. R. Matthews, T. K. Maycock, T. Waterfield, O. Yelekçi, R. Yu and B. Zhou (eds.)]. Cambridge University Press. In press.
- Information source: Garner, G. G., R. E. Kopp, T. Hermans, A. B. A. Slangen, G. Koubbe, M. Turilli, S. Jha, T. L. Edwards, A. Levermann, S. Nowikci, M. D. Palmer, C. Smith, in prep. Framework for Assessing Changes To Sea-level (FACTS). Geoscientific Model Development.
- Information source: Garner, G. G., T. Hermans, R. E. Kopp, A. B. A. Slangen, T. L. Edwards, A. Levermann, S. Nowikci, M. D. Palmer, C. Smith, B. Fox-Kemper, H. T. Hewitt, C. Xiao, G. Aðalgeirsdóttir, S. S. Drijfhout, T. L. Edwards, N. R. Golledge, M. Hemer, R. E. Kopp, G. Krinner, A. Mix, D. Notz, S. Nowicki, I. S. Nurhati, L. Ruiz, J-B. Sallée, Y. Yu, L. Hua, T. Palmer, B. Pearson, 2021. IPCC AR6 Sea-Level Rise Projections. Version 20210809. PO.DAAC, CA, USA. Dataset accessed [YYYY-MM-DD] at https://podaac.jpl.nasa.gov/announcements/2021-08-09-Sea-level-projections-from-the-IPCC-6th-Assessment-Report.
- Information reference: We thank the projection authors for developing and making the sea-level rise projections available, multiple funding agencies for supporting the development of the projections, and the NASA Sea-Level Change Team for developing and hosting the IPCC AR6 Sea-Level Projection Tool. We also acknowledge the World Climate Research Programme, which, through its Working Group on Coupled Modelling, coordinated and promoted CMIP6. We thank the climate modeling groups for producing and making available their model output, the Earth System Grid Federation (ESGF) for archiving the data and providing access, and the multiple funding agencies who support CMIP6 and ESGF.
Sea Level
AR6 SSP1-2.6
AR6 SSP2-4.5
AR6 SSP5-8.5
Frederikse et al.
- Information source: Frederikse, T., Landerer, F., Caron, L. et al. The causes of sea-level rise since 1900. Nature 584, 393–397 (2020). https://doi.org/10.1038/s41586-020-2591-3
- Information reference: Thomas Frederikse, Felix Landerer, Lambert Caron, Surendra Adhikari, David Parkes, Vincent W. Humphrey... Yun-Hao Wu. (2020). data supplement of 'The causes of sea-level rise since 1900' [Data set]. Zenodo. http://doi.org/10.5281/zenodo.3862995


